Bitcoin Breaks Out: Analyzing the Market's Renewed Bullish MomentumIn-depth Insights into On-Chain Metrics, Price Trends, Derivatives Market, and Macroeconomic Indicators Signaling a Strong Bitcoin Rally Amidst Global Economic ShiftsIntroductionThis week's analysis reveals a significant renewed bullish momentum and cautious hedging strategies among traders. On-chain metrics indicate that Bitcoin has passed the bottom of its consolidation phase, while price and derivative market indicators show increasing confidence. However, macroeconomic signals continue to point towards potential recessionary risks. Let's delve deeper into these key metrics and understand their implications for Bitcoin investors. On-chain Signals for Bitcoin
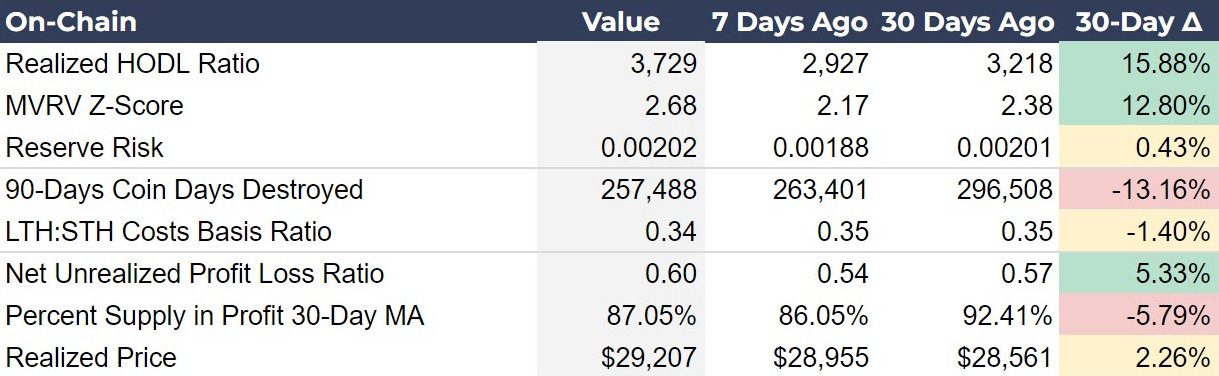
The on-chain metrics suggest that Bitcoin has passed the bottom of its consolidation phase, with indicators like the Realized HODL Ratio and MVRV Z-Score pointing to renewed bullish momentum and increasing confidence among long-term holders. Despite recent price fluctuations, the overall market sentiment is improving, setting the stage for the next leg of the bull market. The Realized HODL Ratio, which compares the realized price of 1-week old UTXOs to 1-2 year old UTXOs, has made a notable reversal. This metric's change in direction, combined with Bitcoin's price breaking significant levels like the 50 DMA, indicates a strong signal of the end of the consolidation phase. Although it has not reached its previous cycle high of ~7,750, the current upward trend aligns with price breakout, reinforcing the bullish sentiment. The MVRV Z-Score, calculated as (market cap - realized cap) / standard deviation of market cap, has shown a positive trend, bottoming out before the Realized HODL Ratio and continuing to rise. This metric signals overvalued or undervalued conditions in the market, with its current increase indicating that Bitcoin is perceived as undervalued. The direction of the MVRV Z-Score reflects market sentiment, where a rising score suggests improving sentiment and a potential undervaluation phase, contrasting with a declining score during consolidation that signifies temporary overvaluation for that cycle phase. 90-Days Coin Days Destroyed, measured as the number of coins spent multiplied by the number of days since they’ve been spent, continues to decline this week. This signals increasing holding behavior. The LTH:STH Cost Basis Ratio started moving again this week, indicating a resumption in bullish price movement. Declines in this metric are what we expect in LTH are winning and slightly distributing coins. Since the LTH cost basis doesn’t move very much in explosive bull markets, it is the STH cost basis that rises rapidly, this metric will fall as the bull market resumes. The end of the bull market is typically marked by this ratio being below 0.2, so we have a long way to go...  Continue reading this post for free, courtesy of Bitcoin Magazine Pro.A subscription gets you:
|
Tuesday, May 21, 2024
Bitcoin Breaks Out: Analyzing the Market's Renewed Bullish Momentum

Subscribe to:
Post Comments (Atom)
Popular Posts
-
A look at everything new on Pulse this month ͏ ͏ ͏ ͏ ͏ ͏ ͏ ͏ ͏ ͏ ͏ ͏ ͏ ...
-
An AI/Fable 5 opinion post, alongside all the things you may have missed from TBL this week. ͏ ͏ ͏ ͏ ͏ ͏ ...
-
Bitcoin jumped after a surprise Iran ceasefire headline—now watch the 200WMA hold and the 200DMA at $77.5K as the next reclaim level. ...
-
Buying $1 of Bitcoin for $0.82? Strategy's discount, RSI, and 200-week support are creating one of its most compelling setups ever. ...
-
Today’s letter will be shorter because I’m traveling to Prague, the capital of the Czech Republic, for arguably the largest and most base...


No comments:
Post a Comment