
Our bi-weekly quantitative risk report for TBL Pros: January 14th, 2026 Edition
͏ ͏ ͏ ͏ ͏ ͏ ͏ ͏ ͏ ͏ ͏ ͏ ͏ ͏ ͏ ͏ ͏ ͏ ͏ ͏ ͏ ͏ ͏ ͏ ͏ ͏ ͏ ͏ ͏ ͏ ͏ ͏ ͏ ͏ ͏ ͏ ͏ ͏ ͏ ͏ ͏ ͏ ͏ ͏ ͏ ͏ ͏ ͏ ͏ ͏ ͏ ͏ ͏ ͏ ͏ ͏ ͏ ͏ ͏ ͏ ͏ ͏ ͏ ͏ ͏ ͏ ͏ ͏ ͏ ͏ ͏ ͏ ͏ ͏ ͏ ͏ ͏ ͏ ͏ ͏ ͏ ͏ ͏ ͏ ͏ ͏ ͏ ͏ ͏ ͏ ͏ ͏ ͏ ͏ ͏ ͏ ͏ ͏ ͏ ͏ ͏ ͏ ͏ ͏ ͏ ͏ ͏ ͏ ͏ ͏ ͏ ͏ ͏ ͏ ͏ ͏ ͏ ͏ ͏ ͏ ͏ ͏ ͏ ͏ ͏ ͏ ͏ ͏ ͏ ͏ ͏ ͏ ͏ ͏ ͏ ͏ ͏ ͏ ͏ ͏ ͏ ͏ ͏ ͏ ͏ ͏ ͏ ͏ ͏ ͏ ͏ ͏ ͏ ͏ ͏ ͏ ͏ ͏ ͏ ͏ ͏ ͏ ͏ ͏ ͏ ͏ ͏ ͏ ͏ ͏ ͏ ͏ ͏ ͏ ͏ ͏ ͏ ͏ ͏ ͏ ͏ ͏ ͏ ͏ ͏ ͏ ͏ ͏ ͏ ͏ ͏ ͏ ͏ ͏ ͏ ͏ ͏ ͏ ͏ ͏
| | |
| Dear Readers, Welcome back to another edition of Mean Median Mode—a quantitative risk report summarizing bitcoin price analysis and global macro narratives to position investors and bitcoin watchers with the data that matters. So, without further ado, here’s our latest risk report.
Bitcoin: Technical Analysis TBL Liquidity Analysis Bitcoin: Correlation Analysis Bitcoin: On-Chain Analytics US Rates Analysis Fed Watch & Money Market Analysis US Economy Analysis
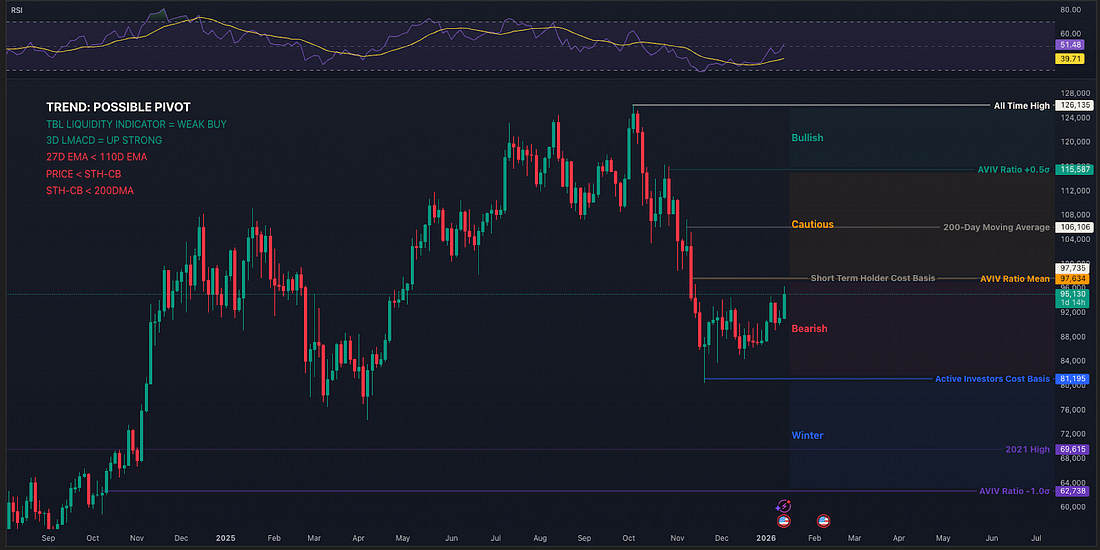
As bitcoin’s role in the global financial landscape evolves, understanding its potential impact on your wealth becomes increasingly crucial. Whether we see measured adoption or accelerated hyperbitcoinization, being prepared for various scenarios can make the difference between merely participating and truly optimizing your position. This is why Unchained developed the Bitcoin Calculator – a sophisticated modeling tool that helps you visualize and prepare for multiple bitcoin futures. Beyond traditional retirement planning, it offers deep insight into how different adoption scenarios could transform your wealth trajectory. What sets this tool apart is its integration with the Unchained IRA – the only solution that combines the tax advantages of a retirement account with the security of self-custody. In any future state, maintaining direct control of your keys remains fundamental to your bitcoin strategy. Explore your potential future What this means for bitcoin and risk assets:🚨 We have added a “what this means for bitcoin and risk assets” summary at the end of all sections, giving you the key takeaway from each section.🚨 Last week, while writing ‘Trend Assessment’, bitcoin was trying to break out of the range in which it has been trading for two months. We showed the same chart as below and pointed out that, to confirm a breakout of the range, we wanted to see an entire candle body above $93,500 and not “just a close”. Our conservative stance was proven right, because the rally got faded again for the third time in this range, and we almost got an engulfing bearish candle. We also said recently that we saw some bullish positioning for January in the options market. Strategy bought 13,000 BTC again last week. And with STRC trading around $100 because of the ex-date on January 15, they probably hit the ATM to cap the price at $100 and will be buying more bitcoin with the proceeds. The overview chart didn’t change much, but one thing to notice is that the Short-Term Holder Cost Basis is now practically equal to the AVIV ratio mean, which is very interesting. Price getting above the STH-CB means the trend reversed from a downtrend to an uptrend. Price getting above the AVIV ratio mean tells us that the regime changed back from (mini) bear to bull. We’ll explain this further in the on-chain analysis section.
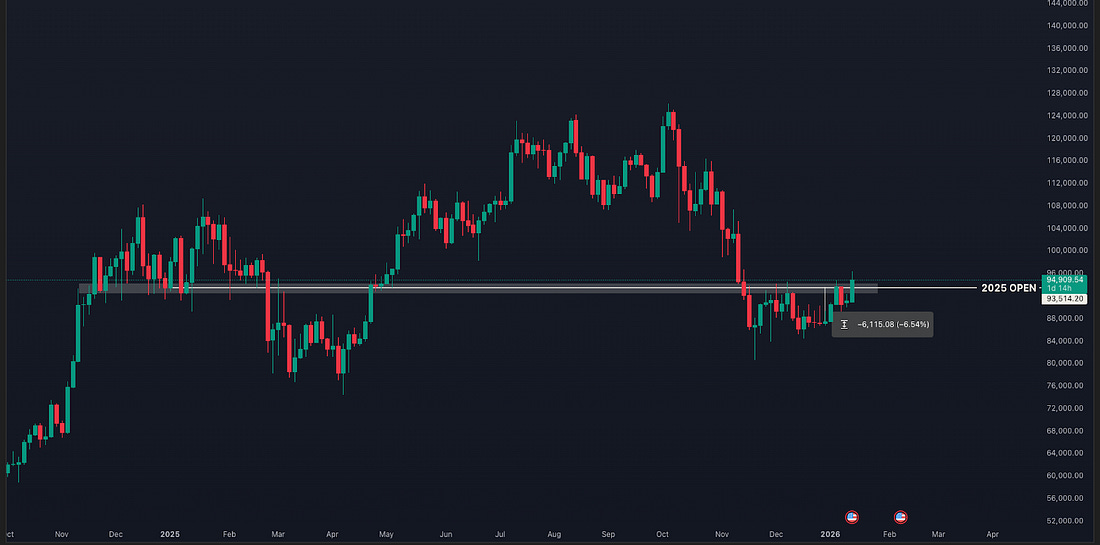
This is the same 3-day chart, but with another emphasis. We drew this chart to show that a gain in price not only puts price above dynamic averages, but would also reclaim this important level. We described last week that it showed demand (support) in late 2024 and early 2025, but has shown supply (resistance) in late 2025 and early 2026. Dr. Andre Dragosch (Head of Research Europe at Bitwise) pointed out that they’ve flagged this level as important to reclaim, because it’s also the 2025 open, and regaining this level means price is catching up on last year’s losses.
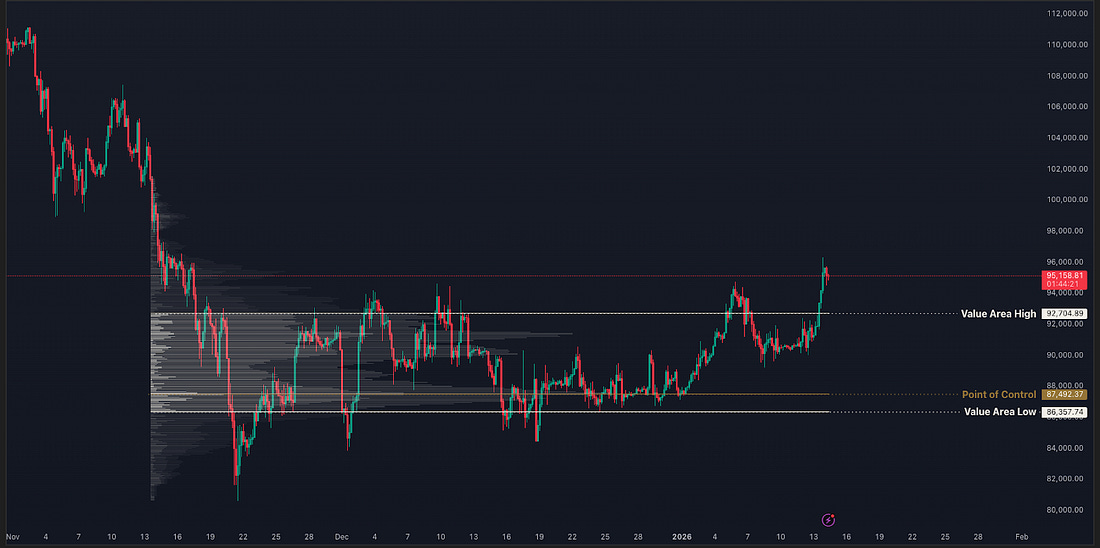
We’ve been showing you this chart since November. It shows that price is stepping from range to range. In every range, the market is trying to find where demand is and where supply is. Nobody knows how long price will trade in a certain range, because in the end nobody knows exactly how much bitcoin people are willing (and able!) to buy and how much bitcoin people are willing (and forced!) to sell. A lot of traders got chopped up by this recent price action. Being able to put the price action in perspective, as price trying to find equilibrium in a certain range, gives you more clarity and could prevent you from buying the top of the range out of greed (FOMO) and selling the bottom of the range out of fear.
What this means for bitcoin and risk assets:...Subscribe to The Bitcoin Layer to unlock the rest.Become a paying subscriber of The Bitcoin Layer to get access to this post and other subscriber-only content. A subscription gets you: | Exclusive access to the TBL Liquidity Indicator and Live Research Dashboard | | Actionable levels and price structure analysis for Bitcoin | | Macro and risk insights that guide positioning decisions |
| |


No comments:
Post a Comment