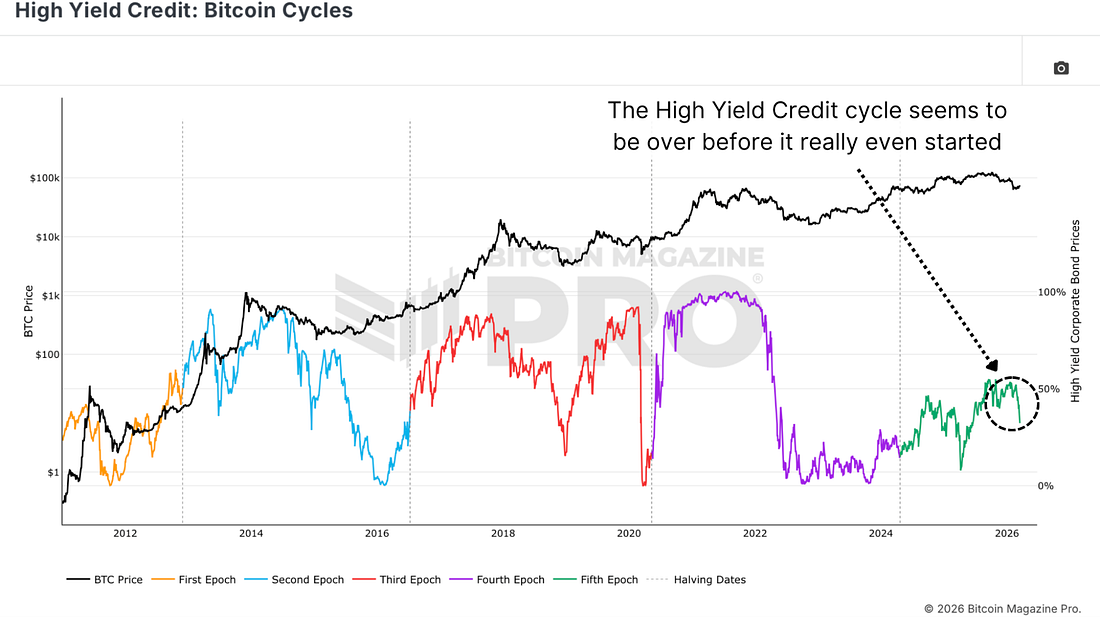
Is This Finally Bitcoin's Decoupling Moment?Diverging signals across credit markets, equities, and on-chain data suggest Bitcoin may be entering a new phase.It’s been a narrative that’s floated around the Bitcoin space for years. The idea that Bitcoin will eventually stop moving in lockstep with US equities and start behaving as its own independent asset, driven by its own supply and demand fundamentals rather than the broader risk appetite of traditional markets. Every time we’ve had a few bullish weeks while stocks looked shaky, someone’s declared it. And every time, the correlation has reasserted itself. But there are a few reasons to think the current setup might be different. Not a guarantee, but a more legitimate opportunity for decoupling than we’ve seen at any point in Bitcoin’s history. The Risk Appetite SignalA useful place to start is the High Yield Credit cycle. High-yield bonds, corporate debt from companies that carry more risk than investment-grade issuers, are a fairly clean proxy for how much risk appetite exists in traditional markets at any given moment. When investors are feeling confident, they’re happy to take on that extra risk for the higher yield. When sentiment turns, they rotate out fast.
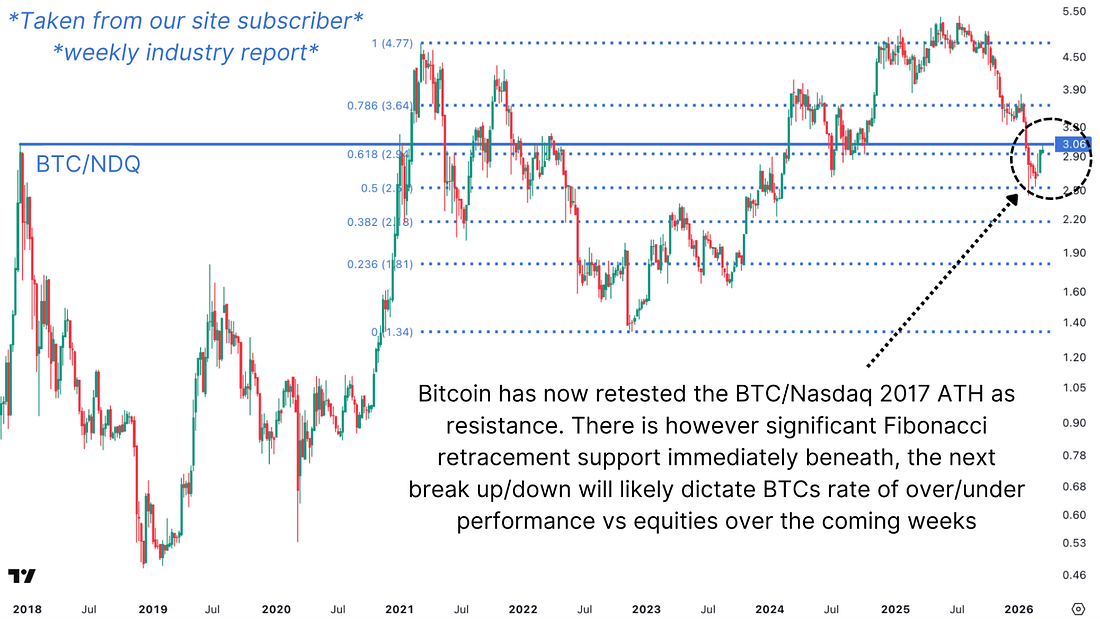
Figure 1: High-yield corporate bond credit rates have remained relatively low in this cycle. In previous Bitcoin cycles, high-yield credit spreads have tended to remain elevated, indicating strong risk appetite in traditional markets, all the way through Bitcoin’s bull market phase. That’s made sense: risk-on conditions in equities and credit markets have historically been a tailwind for Bitcoin and other speculative assets. This time, the risk appetite indicator is declining while Bitcoin has already experienced a significant drawdown of its own. That divergence matters, and it’s part of what makes the current environment genuinely unusual. Bitcoin vs. The NasdaqWhen you measure Bitcoin not against US dollars, which lose purchasing power every year, but against comparable assets that people actually rotate capital between, you get a much cleaner picture of relative strength. The Bitcoin-to-Nasdaq ratio is one of the more useful ways to do this.
Figure 2: Viewing Bitcoin relative to the Nasdaq. What the ratio chart shows is that Bitcoin recently retested a significant historical level: its 2017 all-time high in relative terms. If Bitcoin can begin reclaiming ground on this chart, moving higher against tech stocks rather than just against the dollar, it sets a different tone entirely. It would suggest that sophisticated investors are beginning to rotate capital toward Bitcoin rather than away from it, even as equity markets face their own headwinds. That’s a meaningful shift if it materializes.
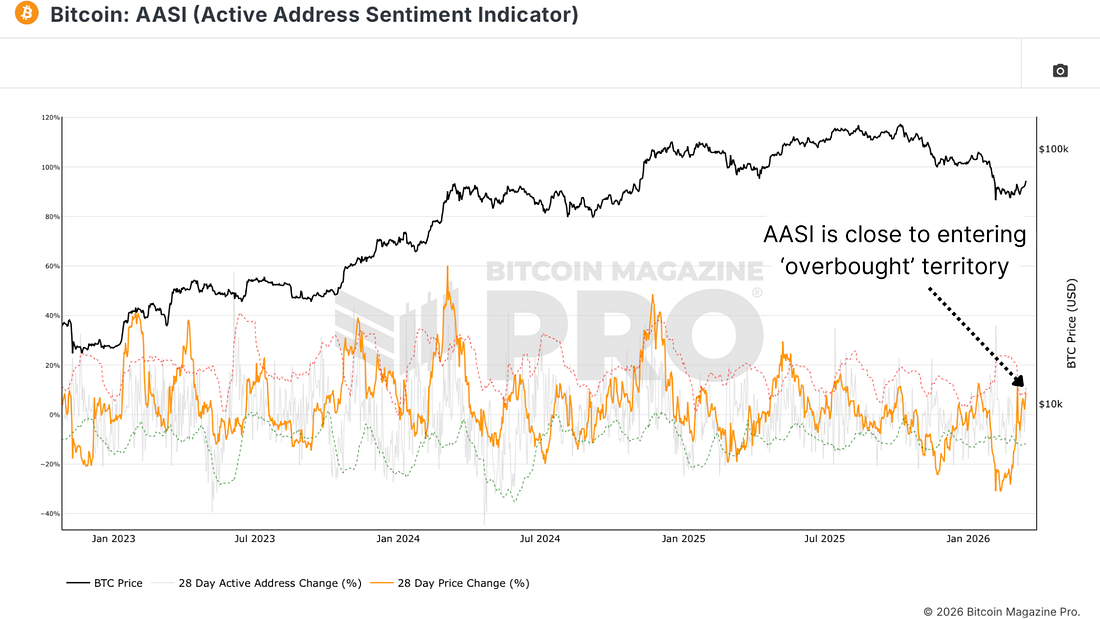
On-Chain IndicatorsThe Active Address Sentiment Indicator had been flagging that Bitcoin’s price had moved upward, perhaps a little faster than the underlying network activity could justify, essentially a mild overextension signal. Price pulled back, which is entirely normal in that context and arguably healthy. A market that consolidates and retests key levels before continuing is generally in better shape than one that runs without pause.
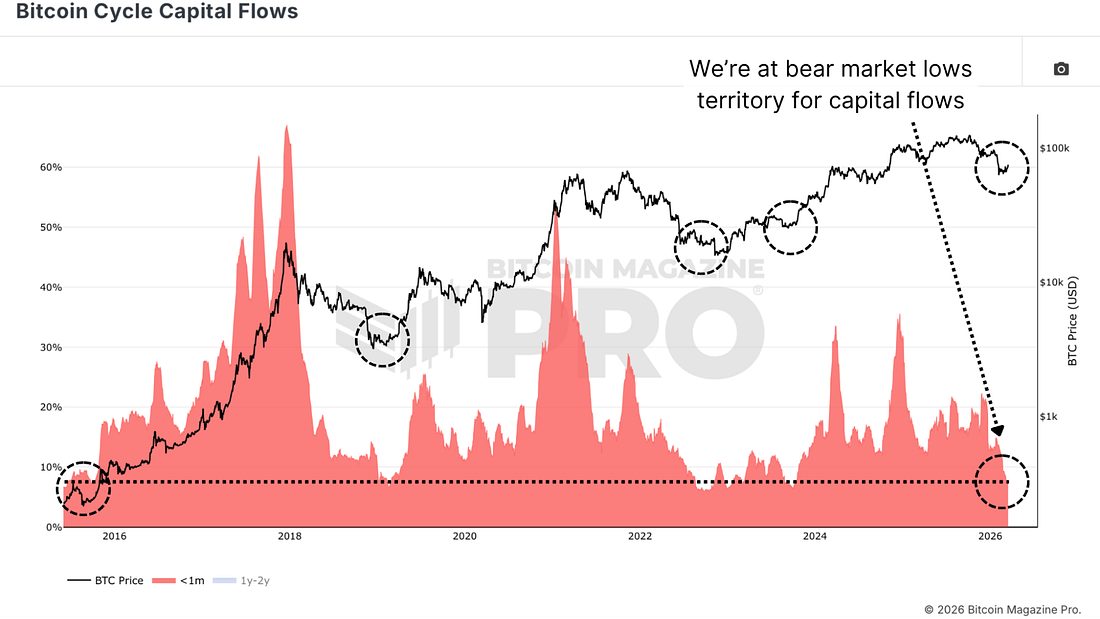
Figure 3: The Active Address Sentiment Indicator reveals overheated market sentiment. More importantly, looking at the Bitcoin Cycle Capital Flows metric, which tracks the movement of capital between newer, shorter-term participants and longer-term, more experienced holders, we’re currently sitting at readings that have historically coincided with bear market lows. This isn’t a timing tool, but it does tell you something about the composition of the current holder base and where in the cycle the market likely sits.
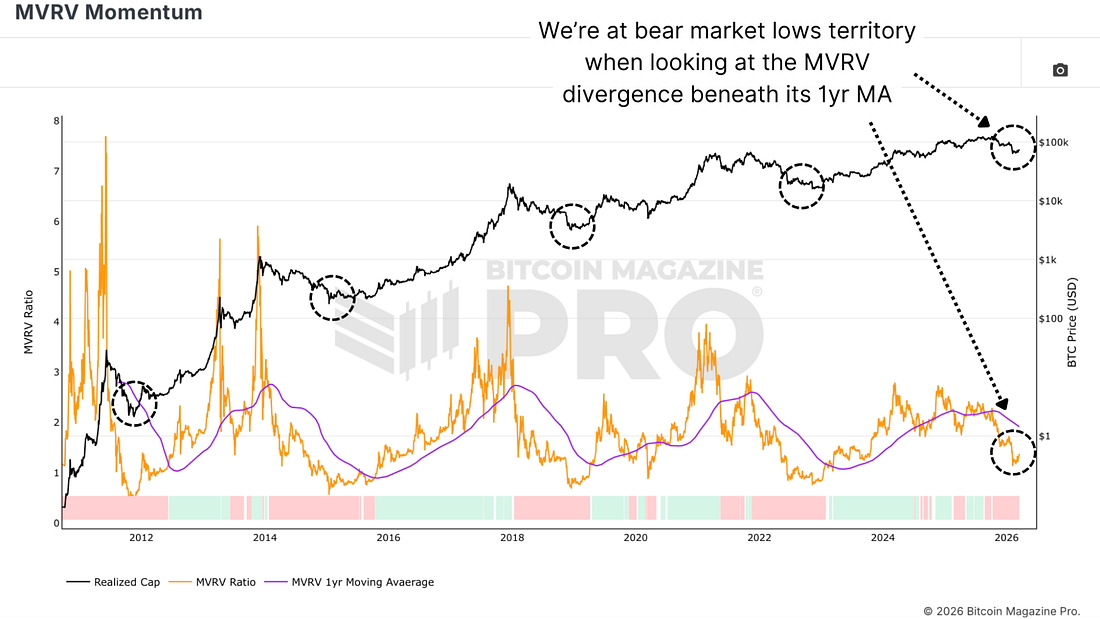
Figure 4: The Bitcoin Cycle Capital Flows chart suggests a possible bear cycle low. The MVRV Momentum IndicatorThe MVRV Momentum Indicator compares Bitcoin’s realized cap, the aggregate cost basis of all coins in circulation, to its own 365-day moving average, then expresses the divergence as a ratio. In simple terms, it measures how far the current market behaviour has deviated from the typical pace of value accumulation over the past year. When this indicator moves into its bottom fifth percentile of historical readings, which it has recently done, it has consistently corresponded with either bear market bottoms or significant accumulation zones throughout Bitcoin’s history. These aren’t frequent events. Getting into that territory requires a sustained and meaningful deterioration in market conditions, and it tends to mark points where the majority of capitulation has already occurred.
Figure 5: The MVRV Momentum chart indicates bear market low conditions. What makes the current reading particularly interesting is the context around it. In previous cycles where this indicator hit these extremely low readings, the S&P 500 was also in the midst of, or had recently concluded, its own significant downturn. This time, US equities are only modestly off their highs. Bitcoin appears to have reached capitulation-level readings on its own internal metrics before the broader equity market has had its own correction. Closing ThoughtsSo, is this decoupling? If Bitcoin continues to gain or hold ground on ratio charts against the Nasdaq and S&P 500 through a period of equity weakness, it might be the best opportunity we’ve ever had for genuine independence from equity market cycles. But Bitcoin hasn’t managed a sustained decoupling from risk assets at any point in its history, and that track record deserves respect. Decoupling would fail if we encounter Bitcoin sell-offs in tandem with equities, as a broader risk-off move, which remains a real possibility. For a more in-depth look into this topic, watch our most recent YouTube video here: Why I think Now Is Bitcoin’s Best Chance To Decouple  Matt Crosby Director of Research & Analytics Bitcoin Magazine Pro
For more detailed Bitcoin analysis and to access advanced features like live charts, personalized indicator alerts, and in-depth industry reports, check out Bitcoin Magazine Pro. Make Smarter Decisions About Bitcoin. Join millions of investors who get clarity about Bitcoin using data analytics you can’t get anywhere else. We don’t just provide data for data’s sake, we provide the metrics and tools that really matter. So you get to supercharge your insights, not your workload. Take the next step in your Bitcoin investing journey:
Invest wisely, stay informed, and let data drive your decisions. Thank you for reading, and here’s to your future success in the Bitcoin market! Disclaimer: This newsletter is for informational purposes only and should not be considered financial advice. Always do your own research before making any investment decisions. We sincerely appreciate your support and hope you found this content valuable. Please leave a like and let us know your thoughts in the comments section; we always welcome feedback from our audience!
|
Friday, March 20, 2026
Is This Finally Bitcoin's Decoupling Moment?


Subscribe to:
Post Comments (Atom)
Popular Posts
-
Dynamic trend levels are coming down, but the bear-market work is not finished yet. ͏ ͏ ͏ ͏ ͏ ͏ ͏ ͏...
-
Higher interest rates are reshaping investor preferences. ͏ ͏ ͏ ͏ ͏ ͏ ͏ ͏ ͏ ͏ ͏ ...
-
A short analysis using nothing but our new TBL MCP Server ͏ ͏ ͏ ͏ ͏ ͏ ͏ ͏ ͏ ͏ ͏ ...
-
gm Bankless Nation, Bitcoin is back above $70,000, but where is it going next? ...
-
A Flash TBL Liquidity Indicator Update ͏ ͏ ͏ ͏ ͏ ͏ ͏ ͏ ͏ ͏ ͏ ͏ ͏ ͏ ...


No comments:
Post a Comment