Will Bitcoin’s Market Malaise End Anytime Soon?Exploring the Convergence of On-Chain Metrics, Price Dynamics, and Macroeconomic Trends as Bitcoin Consolidates, Offering Investor Insights Amidst Global Economic Uncertainties.IntroductionIn this week's detailed analysis of bitcoin’s market metrics, we dive into the dynamics of Bitcoin's market, examining a range of on-chain metrics and price indicators that suggest a consolidation phase with potential for an upcoming bullish reversal. Our detailed exploration extends into derivatives and macroeconomic indicators, where shifts in global liquidity and economic activity provide a backdrop to Bitcoin's increasing appeal as a safe haven asset. As we navigate through complex technical signals and economic data, we uncover strategic insights for investors looking to optimize their positions in a rapidly evolving cryptocurrency landscape. On-Chain Bitcoin Metrics Analysis
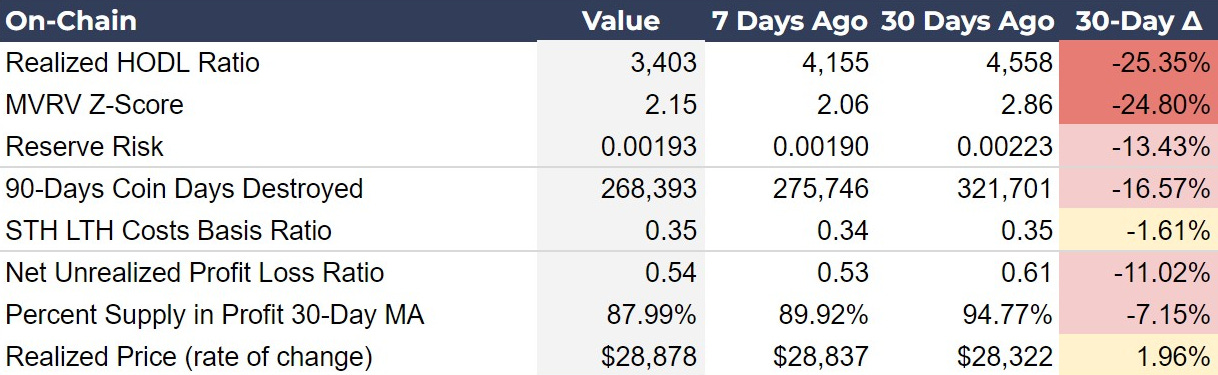
The latest on-chain metrics for Bitcoin illustrate a bull market consolidation in a bottoming behavior, which is similar to the last couple of weeks. The MVRV Z-score, Reserve Risk, STH LTH Cost Basis Ratio and Net Unrealized Profit Loss Ratio are showing a possible bottom this week with reversals in trend from the 7-day versus the 30-day. Meanwhile, the Realized HODL Ratio and Coin Days Destroyed are still noticeably still showing bull market consolidation. Detailed AnalysisRealized HODL Ratio: This metric has decreased significantly over the last 30 days from 4,558 to 3,403, a 25.35% decline. This reduction indicates a significant cooling period or profit taking after a bullish phase. This is the one metric that shows an intensification of the recent downward consolidation, with 65% of the total decline coming in the last week. This could be seen as the last rapid redistribution before a reversal. MVRV Z-Score: The decrease from 2.86 to 2.15 over the last 30 days (-24.80%) indicates that Bitcoin is moving away from overvalued conditions towards a more fairly valued state according to this metric. However, it has increased over the last week, suggesting the market is deeming the current level as fair value, and selling pressure will reduce. Reserve Risk: The flat performance of this metric suggests that the market perceived risk/reward has remained the same. It also happens to be on the bullish side of the historical norms, meaning there is plenty of upside for new investors looking to ride the bull market higher. 90-Days Coin Days Destroyed: Still marching lower but at a slower pace over the last week, indicating that the oldest coins are being moved less frequently, typically a bullish sign. STH LTH Cost Basis Ratio: This metric has remained relatively stable over the last 30 days, with only a slight decrease (-1.61%), suggesting a balance between short-term and long-term holder cost basis. In other words, as measured by this metric, LTH distribution is waning slightly, reducing selling pressure from profit-taking. Net Unrealized Profit/Loss Ratio: This is yet another metric showing a decrease over 30 days, but bottoming-type behavior in the last 7 days. A flat value here suggests the market is experiencing less overall profit, aligning with a cooling or consolidation phase. The slight increase in the last week could be an early indicator of returning optimism...  Continue reading this post for free, courtesy of Bitcoin Magazine Pro.A subscription gets you:
|
Wednesday, May 8, 2024
Will Bitcoin’s Market Malaise End Anytime Soon?

Subscribe to:
Post Comments (Atom)
Popular Posts
-
An AI/Fable 5 opinion post, alongside all the things you may have missed from TBL this week. ͏ ͏ ͏ ͏ ͏ ͏ ...
-
A look at everything new on Pulse this month ͏ ͏ ͏ ͏ ͏ ͏ ͏ ͏ ͏ ͏ ͏ ͏ ͏ ...
-
Today’s letter will be shorter because I’m traveling to Prague, the capital of the Czech Republic, for arguably the largest and most base...
-
Buying $1 of Bitcoin for $0.82? Strategy's discount, RSI, and 200-week support are creating one of its most compelling setups ever. ...
-
Bitcoin Treasuries Report, June 2026 ͏ ͏ ͏ ͏ ͏ ͏ ͏ ͏ ͏ ͏ ͏ ͏ ͏ ͏ ...


No comments:
Post a Comment