Where Are We In This Bitcoin Cycle: On-Chain UpdateExplore key Bitcoin metrics like the Puell Multiple and MVRV Z-Score to understand this cycle’s progress, anticipate price peaks, and prepare for Bitcoin’s potential path toward $200K.With Bitcoin now making six-figure territory feel normal and higher prices a seeming inevitability, the analysis of key on-chain data provides valuable insights into the underlying health of the market. By understanding these metrics, investors can better anticipate price movements and prepare for potential market peaks or even any upcoming retracements. Terminal PriceThe Terminal Price metric, which incorporates the Coin Days Destroyed (CDD) while factoring in Bitcoin’s supply, has historically been a reliable indicator for predicting Bitcoin cycle peaks. Coin Days Destroyed measures the velocity of coins being transferred, considering both the holding duration and the quantity of Bitcoin moved.
Figure 1: Bitcoin Terminal Price has surpassed $185,000. Currently, the terminal price has surpassed $185,000 and is likely to rise toward $200,000 as the cycle progresses. With Bitcoin already breaking $100,000, this suggests we may still have several months of positive price action ahead. Puell MultipleThe Puell Multiple evaluates daily miner revenue (in USD) relative to its 365-day moving average. After the halving event, miners experienced a sharp drop in revenue, creating a period of consolidation.
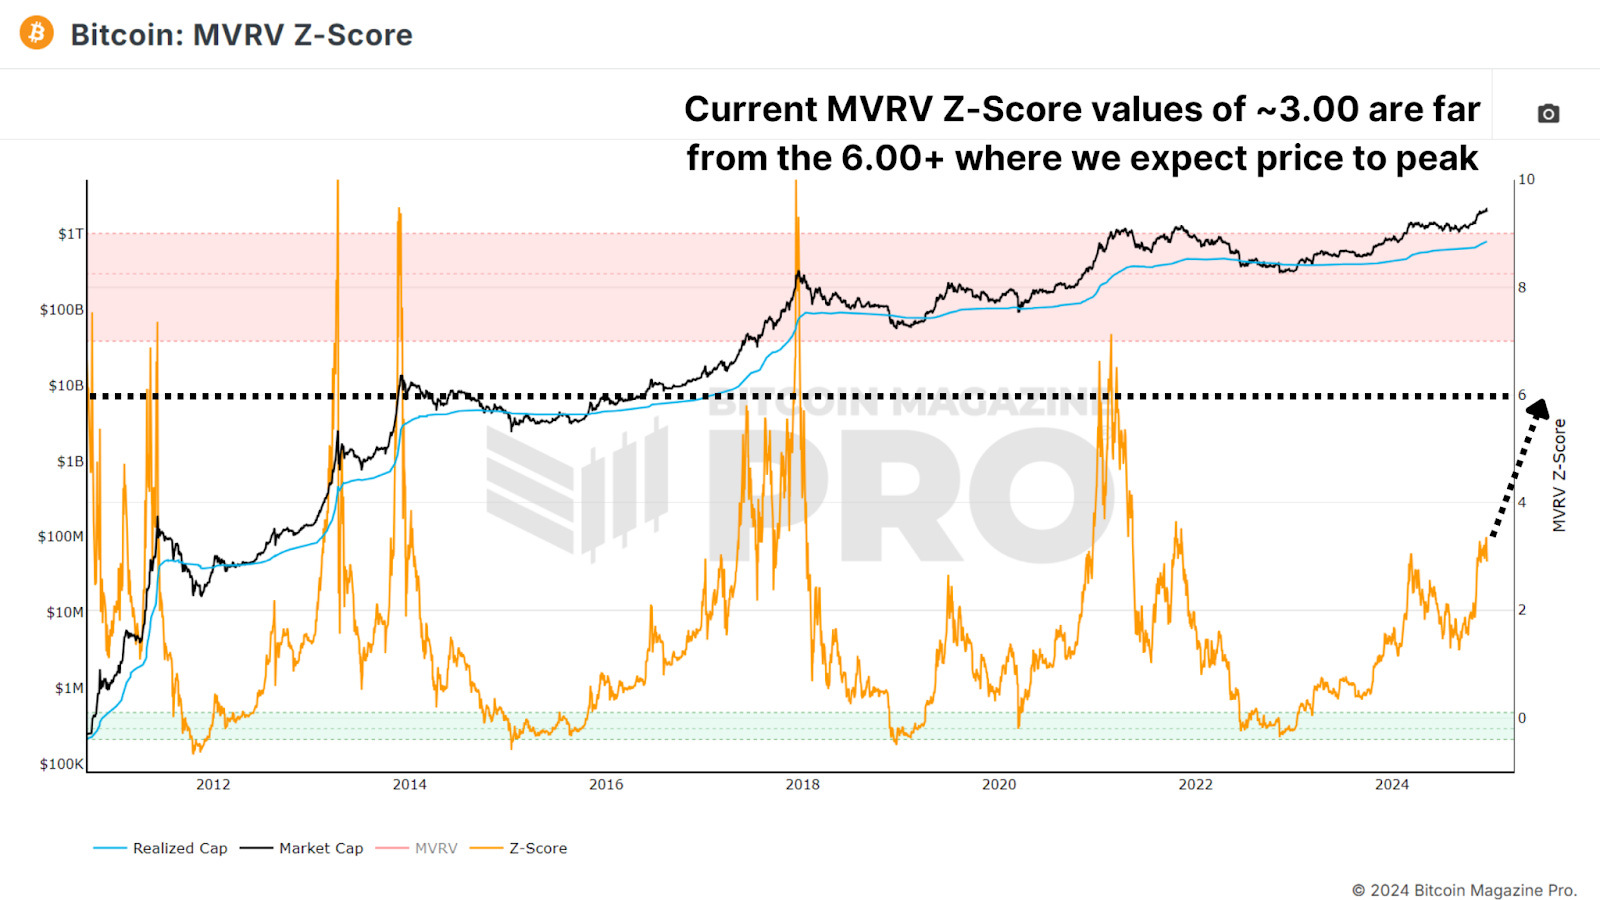
Figure 2: Puell Multiple has climbed above 1.00. Now, the Puell Multiple has climbed back above 1, signaling a return to profitability for miners. Historically, surpassing this threshold has indicated the later stages of a bull cycle, often marked by exponential price rallies. A similar pattern was observed during all previous bull runs. MVRV Z-ScoreThe MVRV Z-Score measures the market value relative to the realized value (average cost basis of Bitcoin holders). Standardized into a Z-Score to account for the asset's volatility, it’s been highly accurate in identifying cycle peaks and bottoms.
Figure 3: MVRV-Z Score still considerably below where previous peaks have occurred. Currently, Bitcoin’s MVRV Z-Score remains below the overheated red zone with a value of around 3.00, signaling that there’s still room for growth. While diminishing peaks have been a trend in recent cycles, the Z-Score suggests that the market is far from reaching a euphoric top. Active Address SentimentThis metric tracks the 28-day percentage change in active network addresses alongside the price change over the same period. When price growth outpaces network activity, it suggests the market may be short-term overbought, as the positive price action may not be sustainable given network utilization.
Figure 4: AASI indicated overheated conditions above $100,000. Recent data shows a slight cooling after Bitcoin’s rapid climb from $50,000 to $100,000, indicating a healthy consolidation period. This pause is likely setting the stage for sustained long-term growth and does not indicate we should be medium to long-term bearish. Spent Output Profit RatioThe Spent Output Profit Ratio (SOPR) measures realized profits from Bitcoin transactions. Recent data shows an uptick in profit-taking, potentially indicating we are entering the latter stages of the cycle.
Figure 5: Large SOPR clusters of profit taking. One caveat to consider is the growing use of Bitcoin ETFs and derivative products. Investors may be shifting from self-custody to ETFs for ease of use and tax advantages, which could influence SOPR values. Value Days DestroyedValue Days Destroyed (VDD) Multiple expands on CDD by weighting larger, long-term holders. When this metric enters the overheated red zone, it often signals major price peaks as the market's largest and most experienced participants begin cashing out.
Figure 6: VDD is warm but not too hot. While Bitcoin’s current VDD levels indicate a slightly overheated market, history suggests it could sustain this range for months before a peak. For example, in 2017, VDD indicated overbought conditions nearly a year before the cycle’s top. ConclusionTaken together, these metrics suggest that Bitcoin is entering the latter stages of its bull market. While some indicators point to short-term cooling or slight overextension, most highlight substantial remaining upside throughout 2025. Key resistance levels for this cycle may emerge between $150,000 and $200,000, with metrics like SOPR and VDD providing clearer signals as we approach the peak. For a more in-depth look into this topic, check out a recent YouTube video here: What's Happening On-chain: Bitcoin Update  Matt Lead Analyst Bitcoin Magazine Pro. Bitcoin Magazine Pro
For more detailed Bitcoin analysis and to access advanced features like live charts, personalized indicator alerts, and in-depth industry reports, check out Bitcoin Magazine Pro. Make Smarter Decisions About Bitcoin. Join millions of investors who get clarity about Bitcoin using data analytics you can't get anywhere else. We don't just provide data for data's sake, we provide the metrics and tools that really matter. So you get to supercharge your insights, not your workload. Take the next step in your Bitcoin investing journey:
Invest wisely, stay informed, and let data drive your decisions. Thank you for reading, and here’s to your future success in the Bitcoin market! 🎁 Special Offer: Use Code: BMPRO For 10% OFF All Bitcoin Conference Tickets
Disclaimer: This newsletter is for informational purposes only and should not be considered financial advice. Always do your own research before making any investment decisions. We sincerely appreciate your support and hope you found this content valuable. Please leave a like and let us know your thoughts in the comments section; we always welcome feedback from our audience!
|
Friday, December 20, 2024
Where Are We In This Bitcoin Cycle: On-Chain Update


Subscribe to:
Post Comments (Atom)
Popular Posts
-
Hear why at DAS NYC ...
-
Crypto is closer than ever to mass adoption, but its founding values aren’t embedded in every blockchain... ...
-
Hyperliquid's HIP-3 framework is putting gold and Tesla stock into the mix for perps traders. ...
-
Also Strategy Has Become A Key Source Of Bitcoin Price Support & Inflation Is Likely Understated By Data Distortions ͏ ͏ ͏ ...
-
People building freedom technology across the globe are watching freedoms disappear at home. ͏ ...


No comments:
Post a Comment