A Very Rare Bitcoin Buy SignalRare DXY drop signals Bitcoin rebound: 3 past cases (2015, 2020, 2022) show consolidation then big rallies.Bitcoin has been struggling with lower lows in recent weeks, leaving many investors questioning whether the asset is on the brink of a major bear cycle. However, a rare data point tied to the US Dollar Strength Index (DXY) suggests that a significant shift in market dynamics may be imminent. This signal, which has only appeared three times in BTC’s history, could point to a bullish reversal despite the current bearish sentiment. Inverse RelationshipBitcoin’s price action has long been inversely correlated with the US Dollar Strength Index (DXY). Historically, when the DXY strengthens, BTC tends to struggle, while a declining DXY often creates favorable macroeconomic conditions for Bitcoin price appreciation.
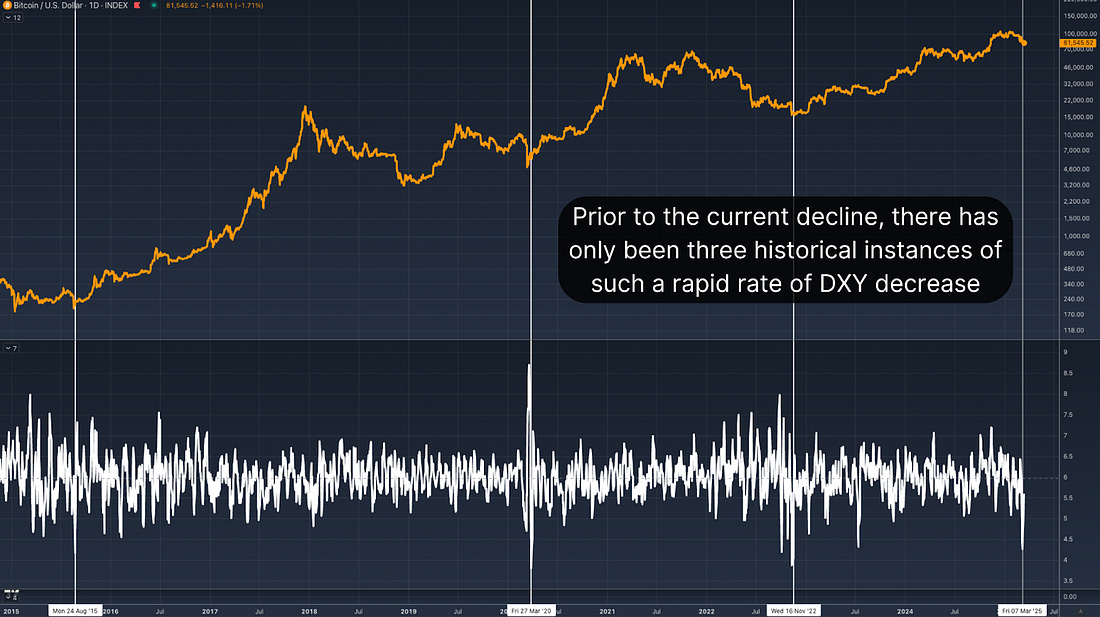
Figure 1: $BTC & DXY have historically had an inverse correlation. Despite this historically bullish influence, Bitcoin’s price has continued to retreat, recently dropping from over $100,000 to below $80,000. However, past occurrences of this rare DXY retracement suggest that a delayed but meaningful BTC rebound could still be in play. Historic OccurrencesCurrently, the DXY has been in a sharp decline, a decrease of over 3.4% within a single week, a rate of change that has only been observed three times in Bitcoin’s entire trading history.
Figure 2: There have only been three previous instances of such rapid DXY decline. To understand the potential impact of this DXY signal, let’s examine the three prior instances when this sharp decline in the US dollar strength index occurred:
The first occurrence was after BTC’s price had bottomed out in 2015. Following a period of sideways consolidation, BTC’s price experienced a significant upward surge, gaining over 200% within months.
The second instance occurred in early 2020, following the sharp market collapse triggered by the COVID-19 pandemic. Similar to the 2015 case, BTC initially experienced choppy price action before a rapid upward trend emerged, culminating in a multi-month rally.
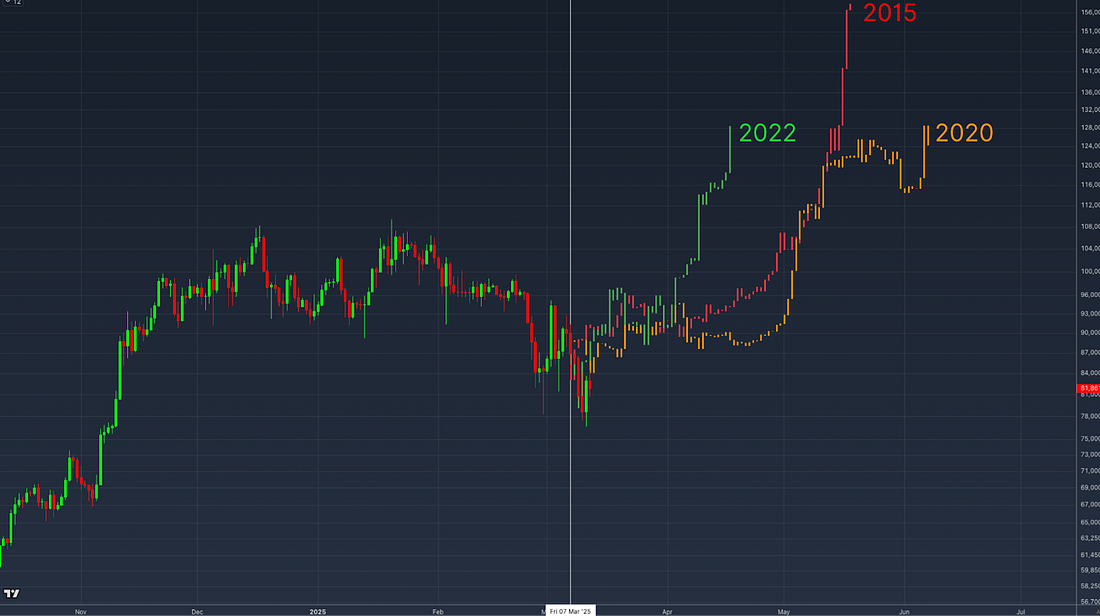
The most recent instance happened at the end of the 2022 bear market. After an initial period of price stabilization, BTC followed with a sustained recovery, climbing to substantially higher prices and kicking off the current bull cycle over the following months. In each case, the sharp decline in the DXY was followed by a consolidation phase before BTC embarked on a significant bullish run. Overlaying the price action of these three instances onto our current price action we get an idea of how things could play out in the near future.
Figure 3: How price action could play out if any of the three previous occurrences are mirrored.
Own a piece of the bitcoin companies you love with as little as $100. Equity MarketsInterestingly, this pattern isn’t limited to Bitcoin. A similar relationship can be observed in traditional markets, particularly in the Nasdaq and the S&P 500. When the DXY retraces sharply, equity markets have historically outperformed their baseline returns.
Figure 4: The same outperformance can be observed in equity markets. The all-time average 30-day return for the Nasdaq following a similar DXY decline stands at 4.29%, well above the standard 30-day return of 1.91%. Extending the window to 60 days, the Nasdaq’s average return increases to nearly 7%, nearly doubling the typical performance of 3.88%. This correlation suggests that Bitcoin’s performance following a sharp DXY retracement aligns with historical broader market trends, reinforcing the argument for a delayed but inevitable positive response. ConclusionThe current decline in the US Dollar Strength Index represents a rare and historically bullish signal for Bitcoin. Although BTC’s immediate price action remains weak, historical precedents suggest that a period of consolidation will likely be followed by a significant rally. Especially when reinforced by observing the same response in indexes such as the Nasdaq and S&P 500, the broader macroeconomic environment is setting up favorably for BTC. For a more in-depth look into this topic, check out a recent YouTube video here:  Matt Crosby Lead Analyst - Bitcoin Magazine Pro Bitcoin Magazine Pro
For more detailed Bitcoin analysis and to access advanced features like live charts, personalized indicator alerts, and in-depth industry reports, check out Bitcoin Magazine Pro. Make Smarter Decisions About Bitcoin. Join millions of investors who get clarity about Bitcoin using data analytics you can't get anywhere else. We don't just provide data for data's sake, we provide the metrics and tools that really matter. So you get to supercharge your insights, not your workload. Take the next step in your Bitcoin investing journey:
Invest wisely, stay informed, and let data drive your decisions. Thank you for reading, and here’s to your future success in the Bitcoin market! 🎁 Special Offer: Use Code: BMPRO For 10% OFF All Bitcoin Conference Tickets
Disclaimer: This newsletter is for informational purposes only and should not be considered financial advice. Always do your own research before making any investment decisions. We sincerely appreciate your support and hope you found this content valuable. Please leave a like and let us know your thoughts in the comments section; we always welcome feedback from our audience!
|
Friday, March 14, 2025
A Very Rare Bitcoin Buy Signal


Subscribe to:
Post Comments (Atom)
Popular Posts
-
Welcome back to the Citizen Daily Brief. Put your stablecoins to work. This is the future of finance, after all. ...
-
Plus $200 off! ...
-
gm Bankless Nation, another week, another data leak. This time though, it was the largest in history, reinforcing the need for pri...
-
Aave and Morpho are the top two lending giants. And they're battling for dominance on Base. Here's what...
-
Hey, I wanted to remind you that The DeFi Edge Pro closes in a few hours . This is the final enrollment window for a while, ...


No comments:
Post a Comment