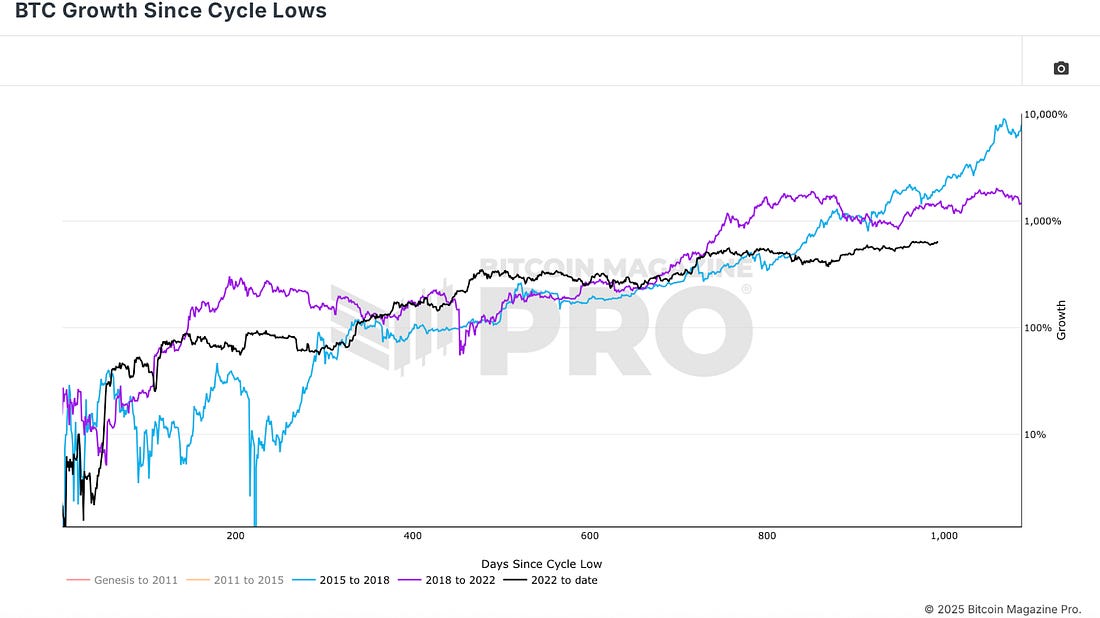
Is Bitcoin Actually Underperforming?Cycle Showdown: Is Bitcoin's 600% Rally Underperforming Past Peaks?Bitcoin currently appears to be on the verge of entering a euphoric phase of price action after an already strong bull market. However, has this cycle truly been as impressive as the USD price chart suggests, or could Bitcoin actually be underperforming when compared to other assets and historical cycles? This analysis digs into the numbers, compares multiple cycles, and examines Bitcoin’s performance not just against the US dollar, but also versus assets like Gold and US tech stocks, to give a clearer picture of where we really stand. Previous CyclesLooking at the Bitcoin Growth Since Cycle Lows chart, the data initially looks promising. From the lows at the tail end of the last bear market, Bitcoin has delivered returns of around 634% at the time of writing. These are significant gains, supported not only by price action but also by strong fundamentals. Institutional accumulation via ETFs and Bitcoin treasury holdings has been robust, and on-chain data shows a large proportion of long-term holders refusing to take profits. Historically, this is the kind of backdrop that precedes a strong run-up phase late in the bull cycle, similar to what we saw in prior cycles.
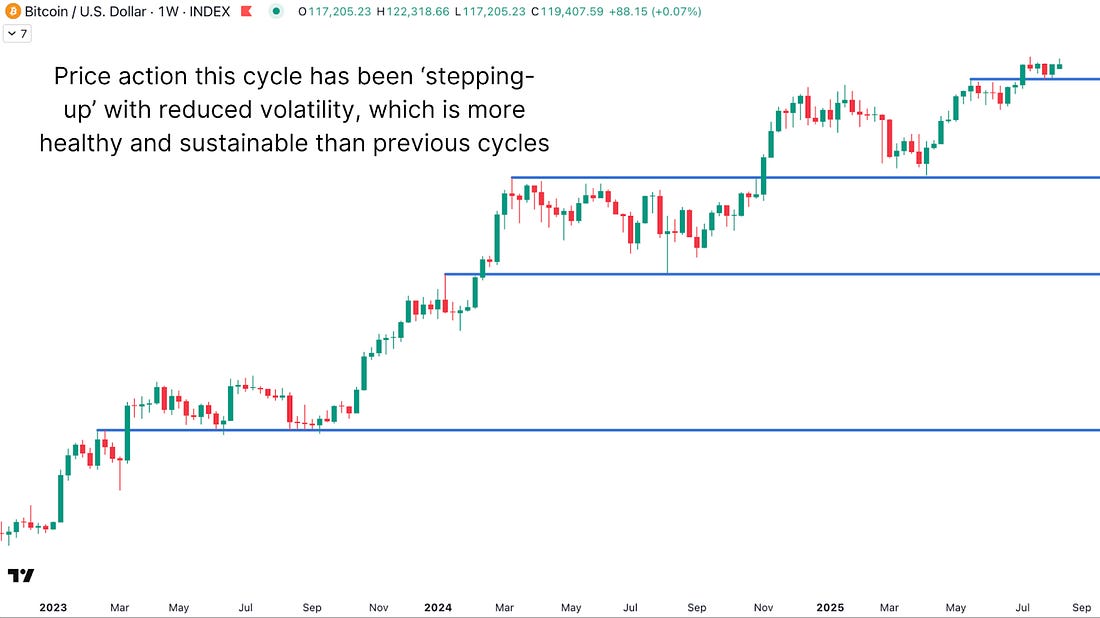
Figure 1: The Bitcoin Growth Since Cycle Lows chart compares the current cycle to its predecessors. Current CycleTurning to the USD price chart on TradingView, Bitcoin’s current cycle does not look bad at all, especially in terms of stability. The deepest retracement this cycle has been around 32%, which occurred after surpassing $100,000 and pulling back to roughly $74,000–$75,000. This is far milder than the 50% or greater drawdowns seen in past cycles. Reduced volatility could mean reduced upside potential, but it also makes the market less treacherous for investors. The price structure has followed a “step-up” pattern, sharp rallies followed by choppy consolidation, then another rally, repeatedly pushing toward new all-time highs. From a fundamental standpoint, the market remains strong.
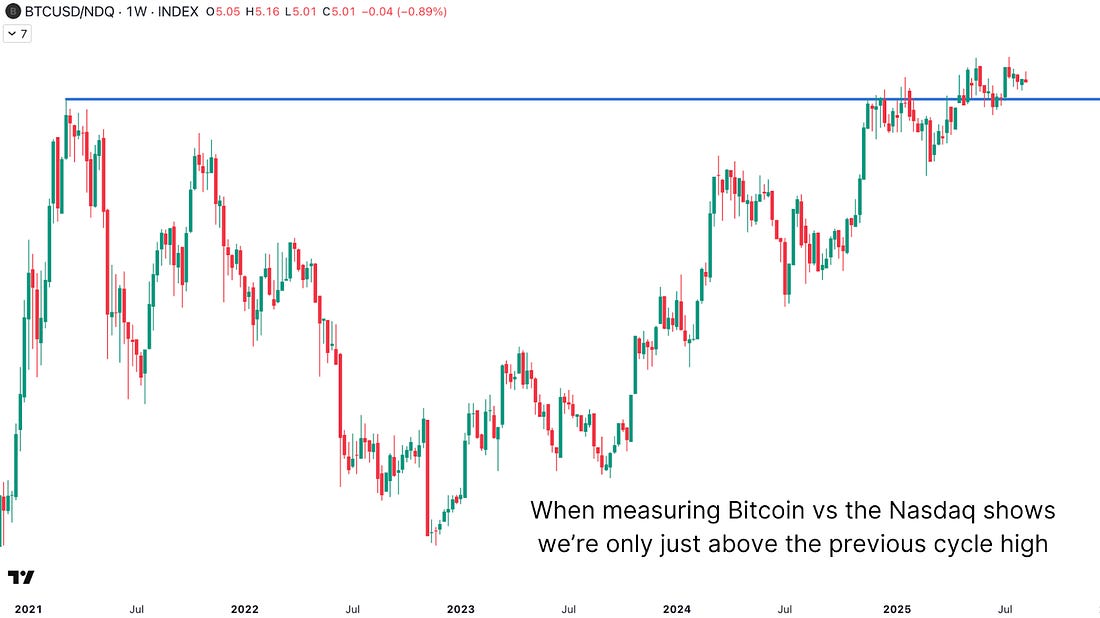
Figure 2: Within the current cycle, a “step-up” has emerged with less volatility than previous cycles. Bitcoin vs Other AssetsWhen measuring Bitcoin against something more stable than the US dollar, such as the NASDAQ or other US tech stocks, a different picture emerges. US tech stocks are also high-growth, speculative assets, so this comparison is a more direct comparison than BTC vs USD. Here, Bitcoin’s performance looks less spectacular. In this current cycle, the climb beyond the previous high has been minimal. However, the chart shows Bitcoin currently turning prior resistance into support, which may set the foundation for a more sustained move higher. What we can also see, looking at the previous double-top cycle, is a second peak at a considerably lower level, suggesting that Bitcoin’s second peak in the last cycle may have been driven more by global liquidity expansion and fiat currency debasement than by genuine outperformance.
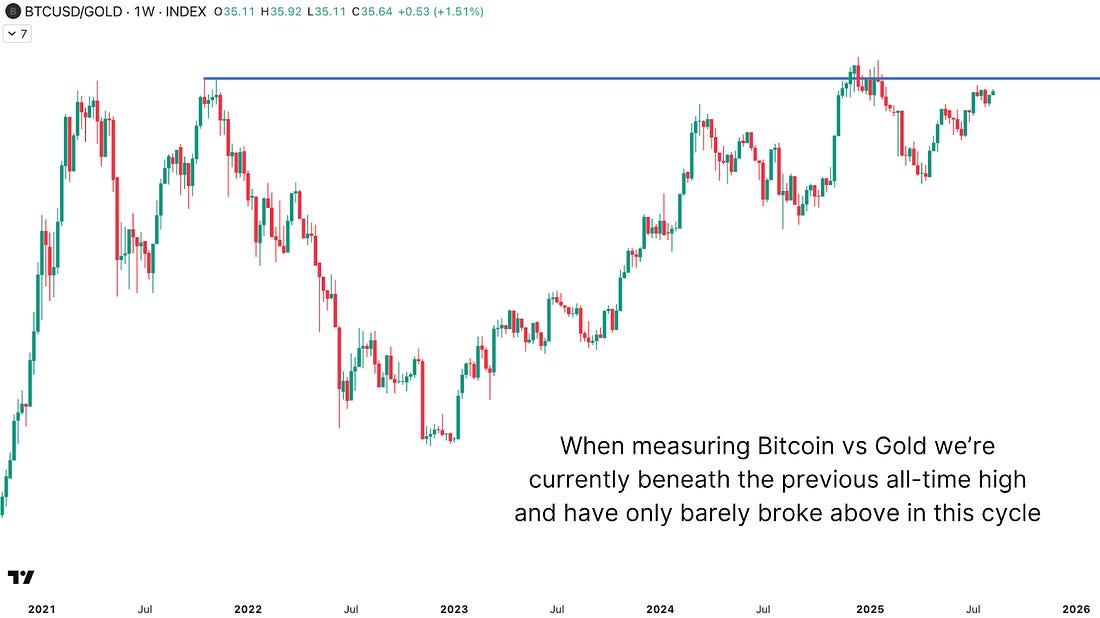
Figure 3: Relative to the Nasdaq, Bitcoin has only recently surpassed its 2021 cycle peak. The “digital gold” narrative invites another important comparison, looking at BTC vs Gold. Bitcoin has still not surpassed its previous all-time high from the 2021 peak when measured in Gold. That means an investor who bought BTC at the 2021 peak and held until now would have underperformed compared to simply holding Gold. Since the last cycle lows, Bitcoin vs Gold has returned over 300%, but Gold itself has been in a powerful bull run. Measuring in Gold terms strips away fiat debasement effects and shows the “true” purchasing power of BTC.
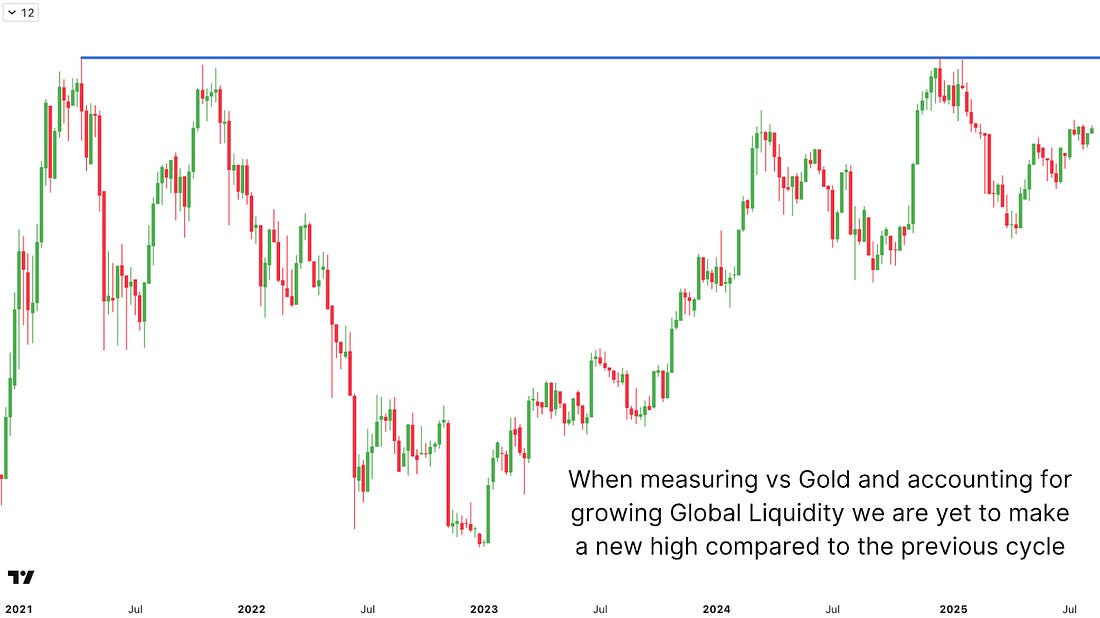
Figure 4: In Gold terms, Bitcoin currently sits below the 2021 cycle peaks, and has only marginally surpassed this level earlier this cycle. True Purchasing PowerTo take this a step further, adjusting the Bitcoin vs Gold chart for Global M2 money supply expansion paints an even more sobering picture. When accounting for the huge liquidity injections into the global economy in recent years, Bitcoin’s cycle peak price in “liquidity-adjusted Gold” terms is still below the prior peak. This helps explain the lack of retail excitement, as there’s no new high in real purchasing power terms.
Figure 5: The inclusion of Global Liquidity growth into this relative measure also reveals the current cycle has yet to outperform 2021’s. ConclusionSo far, Bitcoin’s bull market has been impressive in dollar terms, with over 600% gains from the lows and a relatively low-volatility climb. Yet, when measured against assets like US tech stocks or Gold, and especially when adjusted for Global Liquidity expansion, the performance is far less extraordinary. The data suggests much of this cycle’s rally may have been fueled by fiat debasement rather than pure outperformance. While there’s still room for significant upside, especially if Bitcoin can break through the liquidity-adjusted resistance and push to even higher highs, investors should also pay close attention to these ratio charts. They offer a clearer perspective on relative performance and could provide valuable clues about where Bitcoin might go next. For a more in-depth look into this topic, check out a recent YouTube video here: New All-Time Highs | But Bitcoin Is Underperforming  Matt Crosby Lead Analyst - Bitcoin Magazine Pro Bitcoin Magazine Pro
For more detailed Bitcoin analysis and to access advanced features like live charts, personalized indicator alerts, and in-depth industry reports, check out Bitcoin Magazine Pro. Make Smarter Decisions About Bitcoin. Join millions of investors who get clarity about Bitcoin using data analytics you can't get anywhere else. We don't just provide data for data's sake, we provide the metrics and tools that really matter. So you get to supercharge your insights, not your workload. Take the next step in your Bitcoin investing journey:
Invest wisely, stay informed, and let data drive your decisions. Thank you for reading, and here’s to your future success in the Bitcoin market! Disclaimer: This newsletter is for informational purposes only and should not be considered financial advice. Always do your own research before making any investment decisions. We sincerely appreciate your support and hope you found this content valuable. Please leave a like and let us know your thoughts in the comments section; we always welcome feedback from our audience!
|
Friday, August 15, 2025
Is Bitcoin Actually Underperforming?


Subscribe to:
Post Comments (Atom)
Popular Posts
-
Wednesday, May 6th at 2:00 PM EST. Free to attend. ͏ ͏ ͏ ͏ ͏ ͏ ͏ ͏ ͏ ͏ ͏ ͏ ...
-
Watch now (42 mins) | Discussing the strength latest risk asset rally | Michael Howell live Q&A next week ͏ ͏ ͏ ͏ ...
-
The $rsETH hack was the biggest disaster among the recent hacks. Here's what happened and what it means for our future. ͏ ͏ ͏ ͏ ͏ ͏ ...
-
And it showed it's still lacking guardrails. ...
-
Tom Lee and Michael Saylor are taking classic Etherean and Bitcoiner approaches to stacking their favorite assets. ͏ ͏ ͏ ͏ ͏ ͏ ͏...


No comments:
Post a Comment