
TBL Weekly #177: Semiconductor Jitters While The US Economy BoomsAn analysis on this week's most important economic prints, as well as a TBL content recap
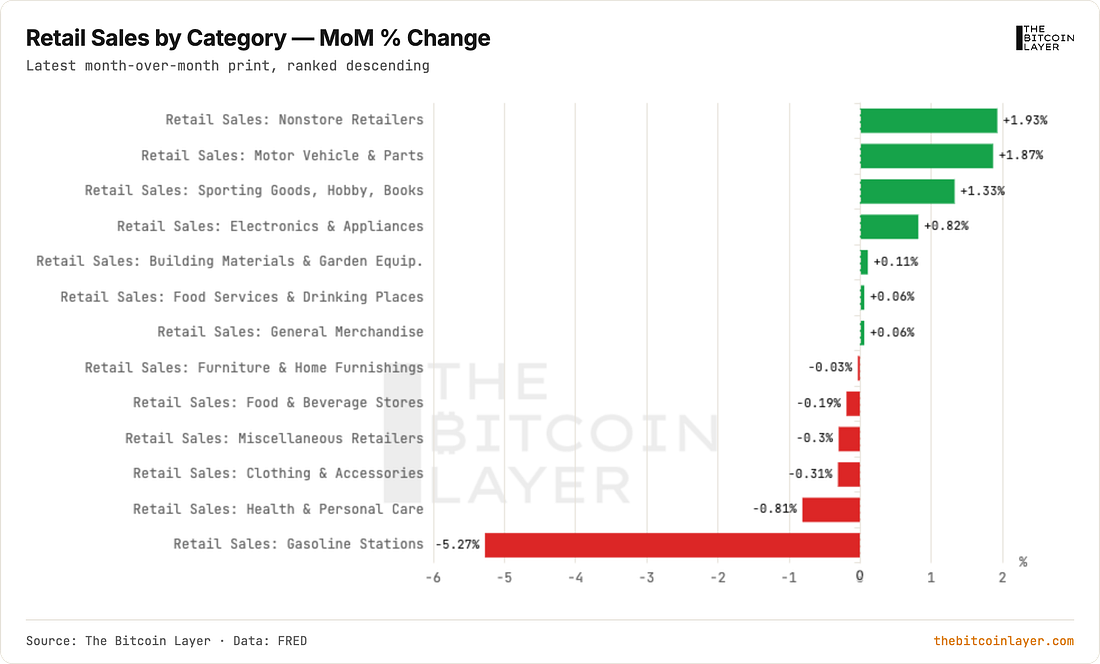
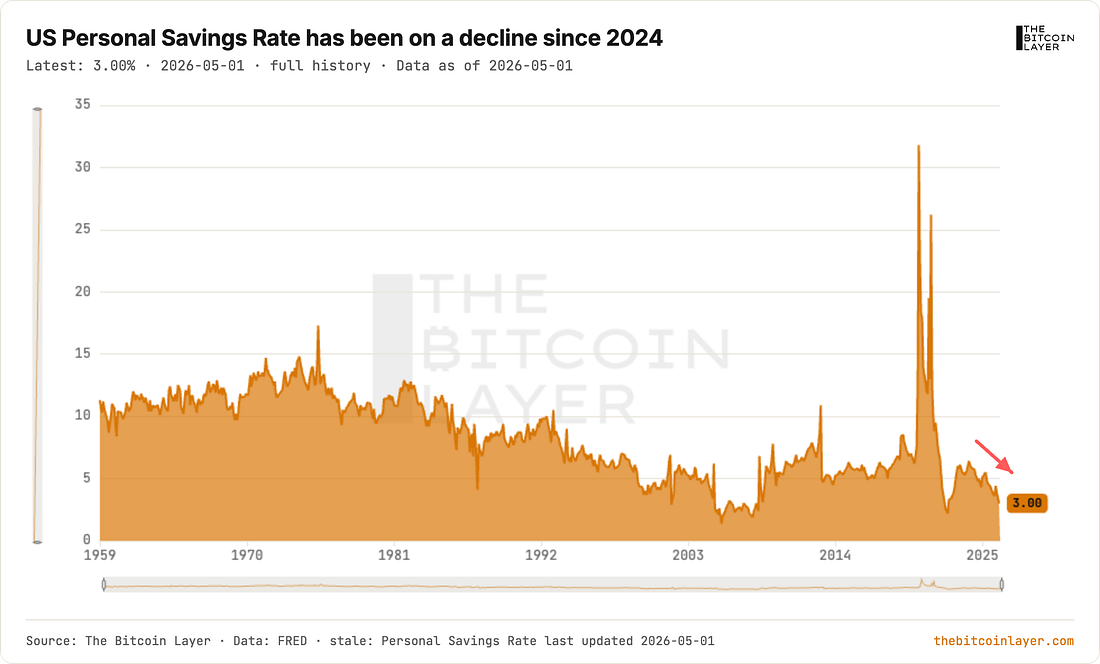
Dear Readers, In the week just past, three events (not including the battle for passage in the Strait) took over headlines. The American consumer, inflation, and semiconductors. Let’s start with what the American consumer showed: As expected, given lower oil prices, a regression back to ‘norm’ in gas station sales was almost inevitable. What is interesting to highlight, however, is that despite the personal savings rate at record lows… …retail sales for nonstore retailers performed the best. We also find more discretionary categories climbing up the MoM ladder, with the “sporting goods, hobby, & books” category placing 3rd on growth rates. Amazon’s Prime Day might’ve had something to do with this, or perhaps consumers at the lower end of the income ladder are able to spend more on things other than basics now that gas prices take up less of their paychecks. The takeaway here is that consumers continue to do what they do best: consume. Article brought to you by:
Open a new health savings account or transfer from an existing HSA. Use code TBL to waive the $50 setup fee. Learn more at SOUNDHSA.com Article brought to you by:
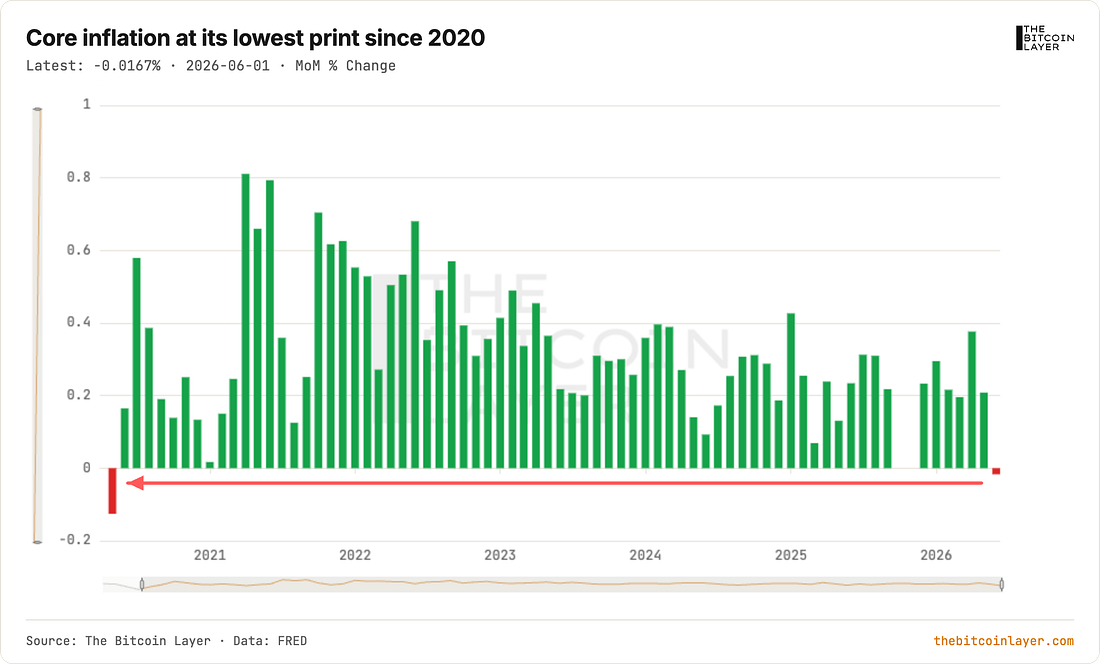
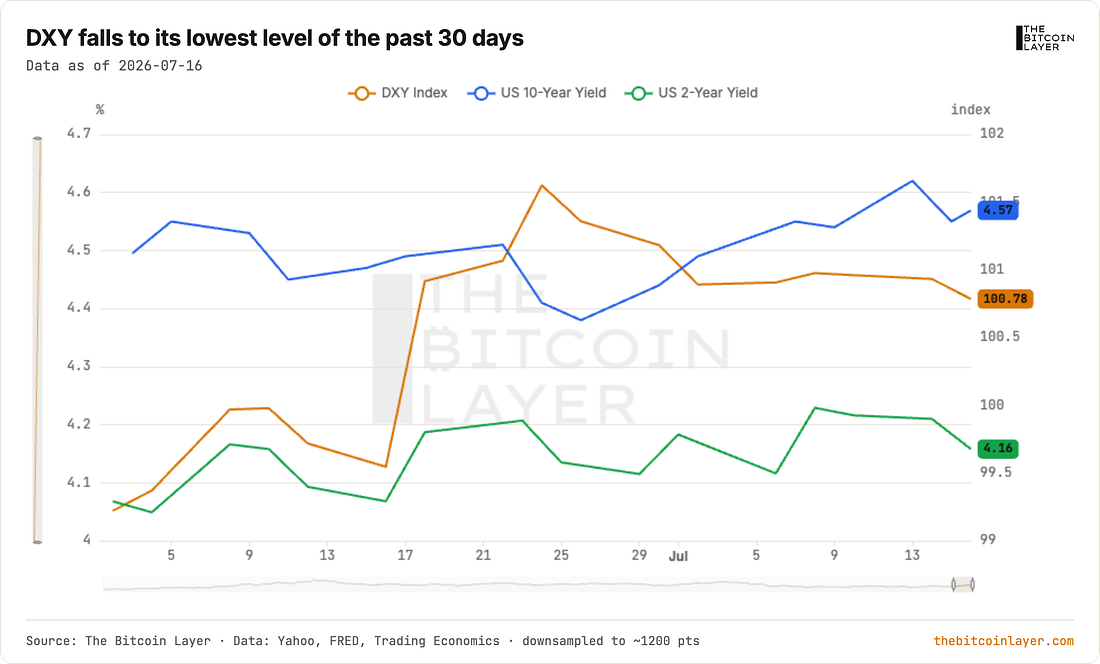
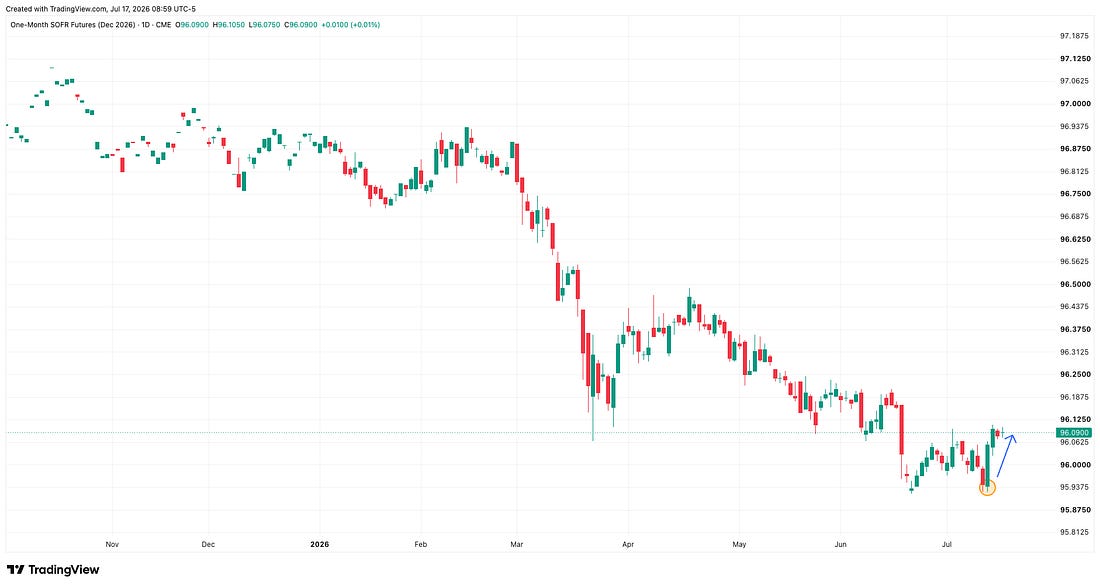
Bitcoin isn’t just an asset. It’s a community. Join 20,000+ Bitcoiners across 71 countries on Club Orange to meet local Bitcoiners, discover events, find bitcoin-friendly merchants, and grow your network. Inflation was one of the biggest market movers this week (especially when looking at TBL Liquidity components). When stripping out food and energy, the monthly change in inflation came in at one of its lowest prints so far in this interesting 2020s decade: This brought the US dollar down to its lowest level of the past month given the drop in yields: With such cool inflation prints, expectations of a more dovish (or, should I say, less hawkish) Fed seeped into market narratives, causing SOFR December 1-month futures to bounce off their YTD low levels of 95.925, or an expected December SOFR rate of 4.075% (read as the market expecting two hikes by EOY):
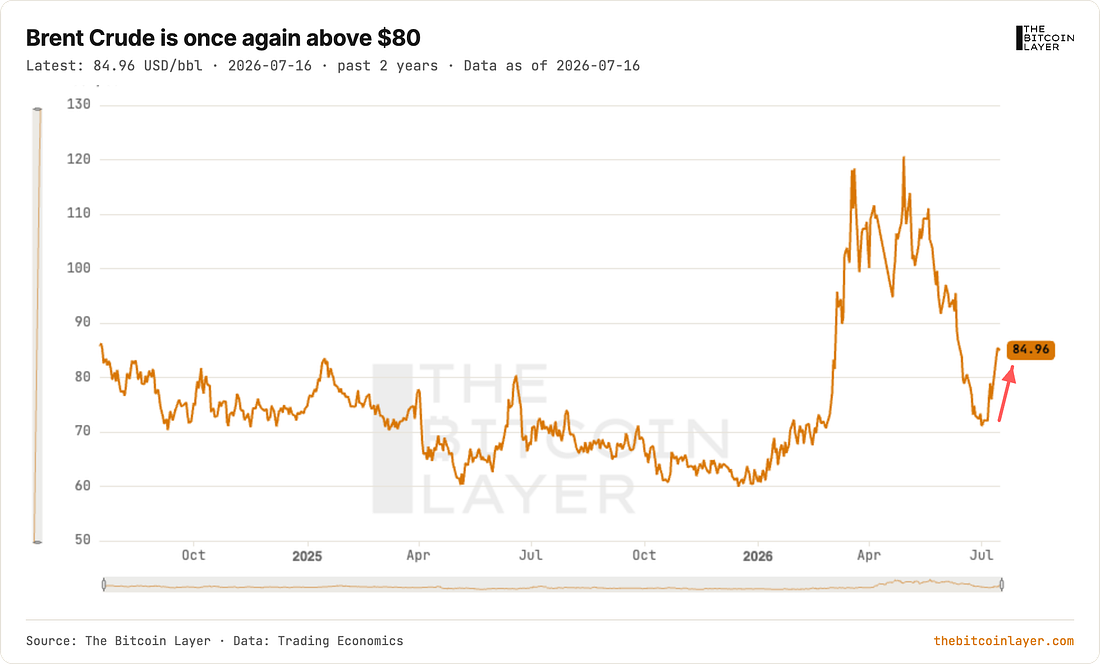
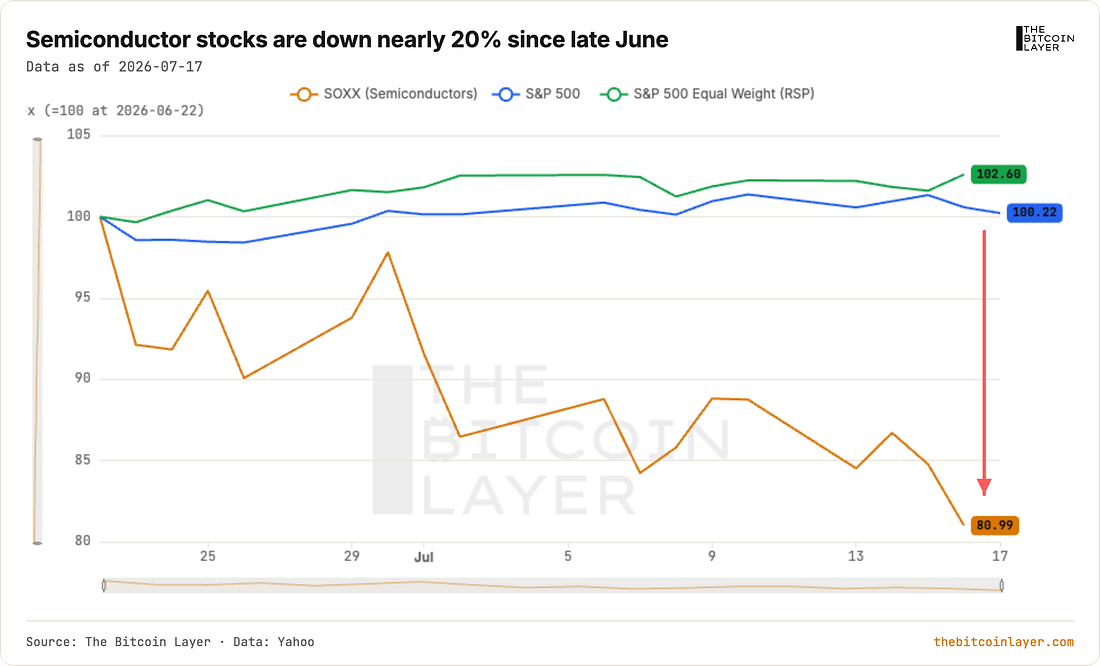
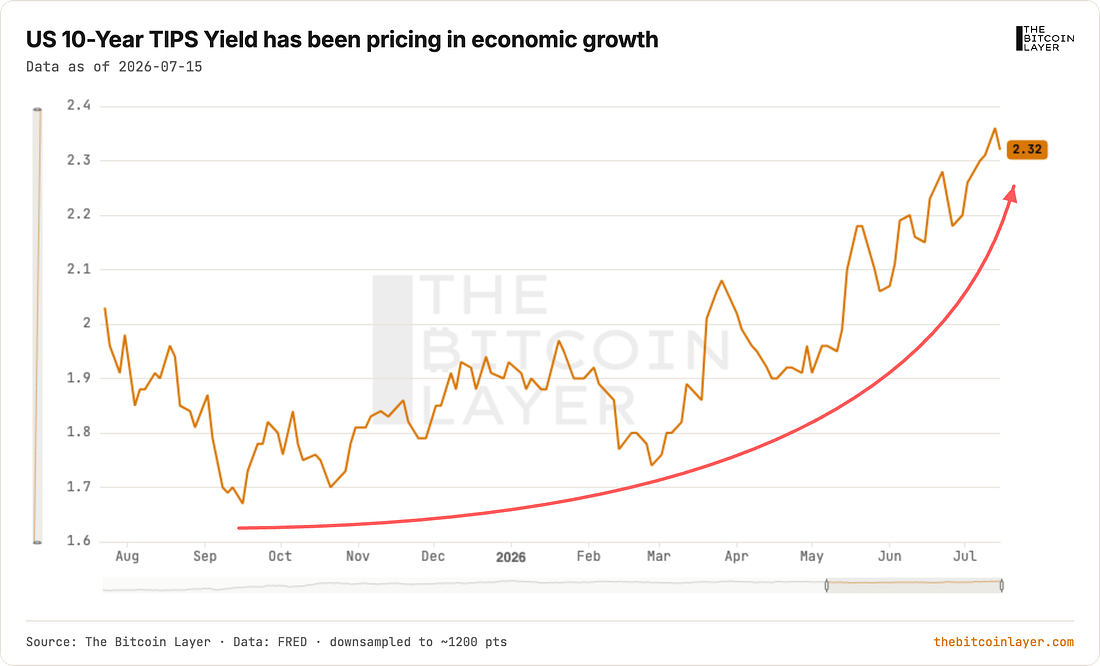
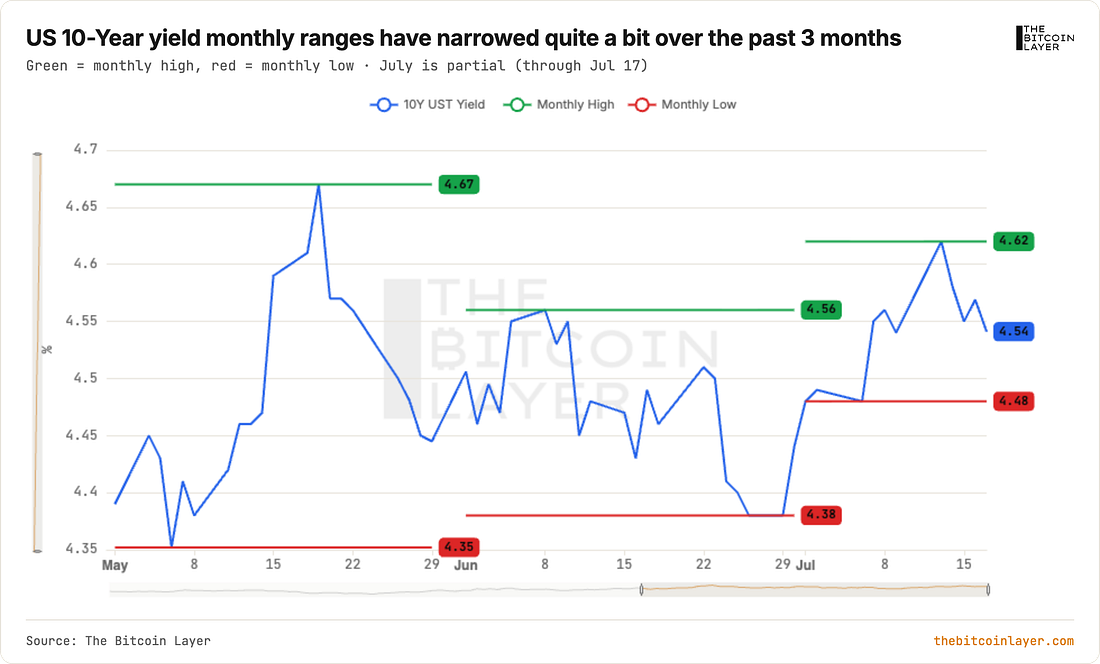
After that bounce, SOFR futures have cut those 2-hikes predictions in half. These easing expectations gave equities and bitcoin a momentary boost early in the week before markets started truly digesting shared strikes at the Strait of Hormuz. Oil has once again surged above $80: This has brought renewed angst amongst risk investors, especially during a time when contrarian indicators appear to be signaling technical corrections for highly valued semiconductor stocks: Nevertheless, US Treasury markets (specifically TIPS - real yields) have been pricing in economic growth since 2H25: With tier 1 economic data out of the way for this month, as well as the FOMC pre-meeting blackout period, we don’t expect much volatility in Treasuries. In fact, the monthly range in 10s has slowly narrowed over the past three months (chart below), showing a bit more certainty (or perhaps less drama) in the UST market:
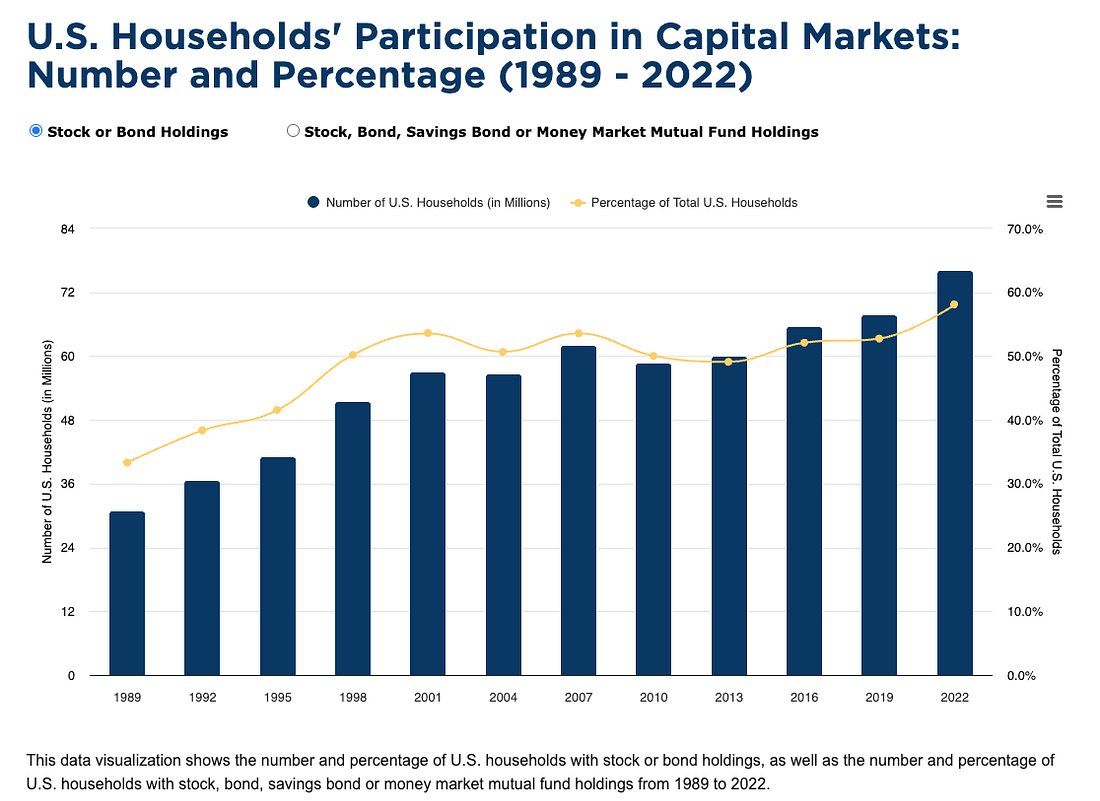
That said, narrowing ranges are also a perfect set-up for a breakout, and the two main catalysts left for this month are the FOMC meeting and the Strait. As we set up for midterm elections this Fall, I am biased toward a bullish breakout (lower yields), as high inflation from oil is not something you’d want voters to bring into the ballots this November. On the semiconductor/AI jitters, there is also something to be said about these American companies being too big to fail now. These AI Goliaths represent two things:
In short, if you want to keep consumers spending, a stock market “put” must be sold to protect the wealth effect. So, to summarize all these variables:
TBL Liquidity Indicator - Latest DotI want to explain our methodology for our TBL Liquidity indicator, as many questions have come up about it. The best way to explain it is through an example: Where does peak temperature actually take place? Say the temperature over one week was:
In this example, Wednesday was the hottest day. If, for whatever reason, we needed smoother data than these points, we could use a few different methods. Method 1: One-sided (3-day trailing average, looking only backward):
The trailing line says the peak was Thursday, which is a day late, as it is dragging along the cold days from before, so it always notices the turn after it already happened. Hard to detect a true peak here. Method 2: Two-sided (3-day centered average, looking both ways):
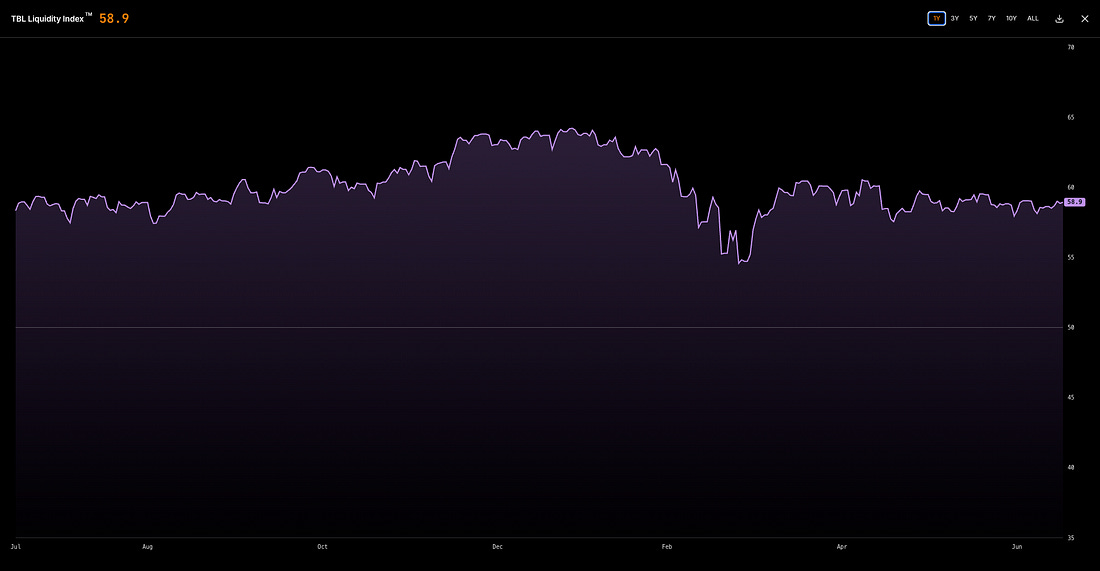
The centered line says the peak was Wednesday, which is correct. To smooth Wednesday, it balanced the days on both sides of it, so it sits right on top of the true turn. True peak detected. The catch: the two-sided method is more accurate about where the turn really was… but to truly detect that peak, it needed days that hadn’t happened yet if today was Wednesday. So a two-sided method can’t fully finish the most recent points in real time. It waits on future data that doesn’t exist yet. As new days arrive, the tip of the smooth line gets filled in and slightly revised. In short: A normal moving average only looks behind it, so it always spots a turn on wrong dates. A two-sided method looks both behind and ahead, so it spots the turn exactly where it happens, but since “ahead” hasn’t happened yet, it has to wait a bit to be sure. Both lag, but one detects the exact spot of peaks and troughs, while the other doesn’t. Our TBL Liquidity Indicator was designed to detect exactly where short-term liquidity turns take place, so we use a two-sided method. Our latest dot is so shallow that we wouldn’t be surprised if new data actually ended up deleting the dot. And that again comes down to the fact that TBL Liquidity is moving sideways (chart below). This is precisely why we developed the confirmed and unconfirmed framework. That is the true indicator. You can also get access to our charts and data inside our TBL Pulse Dashboard:
Substack This Week
YouTube This Week
For Podcast ListenersHere are the links to our latest episode: SPOTIFY
APPLE
Our videos are on major podcast platforms—take us with you on the go! Keep up with The Bitcoin Layer by following our social media! Disclaimer The TBL Model Portfolio, TBL Liquidity Indicator, and all TBL research outputs reflect Nik Bhatia and team’s analytical positioning for the macro and bitcoin environment. They are published for educational purposes only and are not investment advice, not a solicitation to buy or sell securities, and not a recommendation tailored to any individual’s portfolio. The Bitcoin Layer is not a registered investment advisor and does not manage client money. Please consult a professional financial advisor and conduct independent due diligence before making investment decisions. Thanks for reading The Bitcoin Layer — for access to all content, upgrade to paid!
|













No comments:
Post a Comment