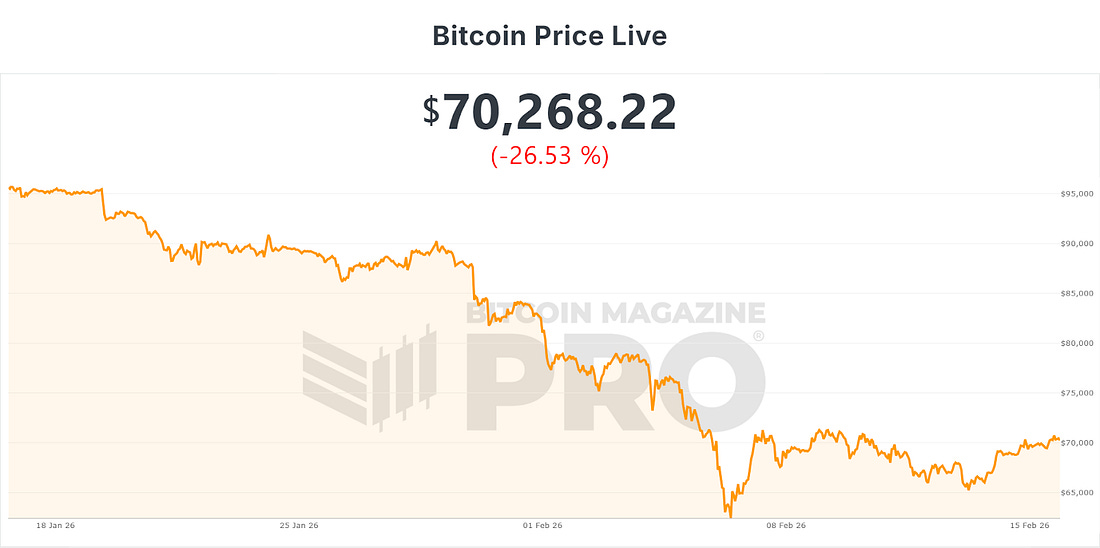
3 Potential Levels for a Bear Market LowFrom Realized Price to the 200-Week Moving Average, we examine three historical support zones that could define Bitcoin’s next macro bottom.What’s HappeningPrice ActionBitcoin is in a period of consolidation after its push down to $60,000 on the 8th February, which is the sharp down move at the bottom of the chart below. The chart shows the past month’s price action: a broad downtrend, followed by a capitulation on 8th Feb, and since then, consolidation.
Figure 1: BTC past month price action. Over the past few days, it has been trading around $70,000 as the market tries to determine whether the next major trend will be up or down. Such periods can be particularly dangerous for trend traders, who may get caught up in choppy price action that ultimately goes sideways, frustrating both long-biased and short-biased trend traders. The bears remain convinced that Bitcoin will plunge down below the two major supports of the 200-week moving average and Realized Price - see our main story below - which is certainly a possibility, but for now BTC is trying to break back upwards into the +$70,000 range.
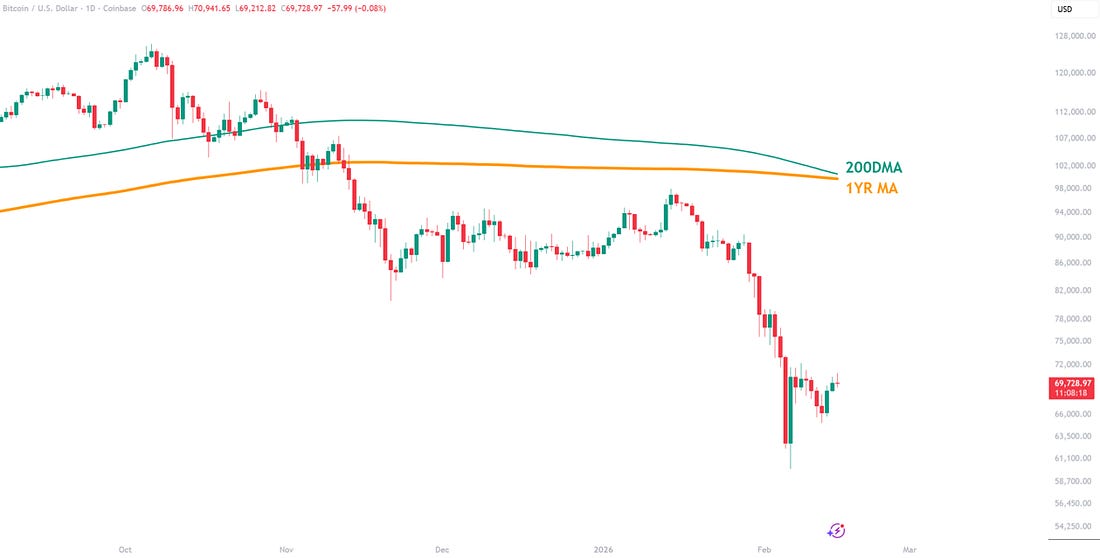
Figure 2: Bitcoin trying to consolidate after the drop to $60,000. If Bitcoin can break above the low $70,000’s, then there is very little resistance between there and the bottom of the range, where price broke down at the start of the year in the low $80,000’s. Such a move would definitely catch the bears off guard, but there is no sign just yet that BTC is ready to do it. Patience may be required for a while, especially as BTC continues to chop within the current narrow range around $70,000.
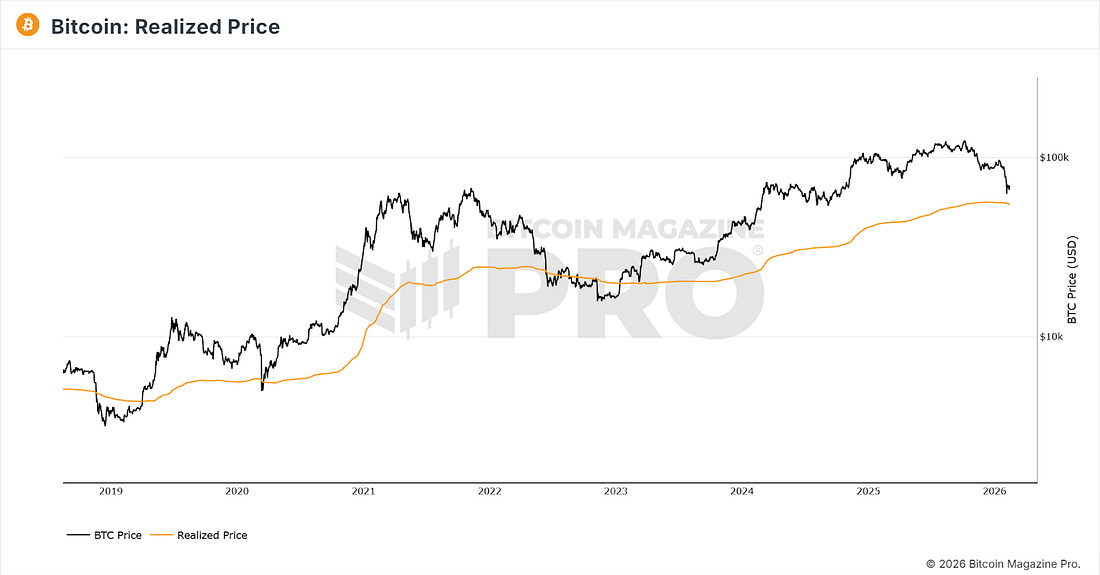
The Big Story: How Low Could Bitcoin Go?Bitcoin has strongly rebounded from $60,000, and that may well be as low as it goes before climbing back up, ultimately to new all-time highs. However, many believe that with geopolitical uncertainty and traditional markets looking questionable, there may be further pain in store for Bitcoin in 2026. Should such a bearish scenario play out, how much further is Bitcoin likely to go down from here? Below, we look at three charts that show potential levels at which Bitcoin could bottom to form a bear market low before moving up into a new bull run. Note, Bitcoin certainly does not HAVE to go down to any of these levels, but it is always a worthwhile exercise to look at scenarios and consider what you would do should price go down to them, to ensure irrational decisions are not made at market extremes. Bitcoin realized price is the average price at which all existing bitcoins last moved onchain, calculated by dividing Bitcoin’s realized cap (the value of each coin at the price it last transacted) by the current circulating supply. It’s often used as an onchain “aggregate cost basis” for the market, meaning when Bitcoin trades above realized price the average holder is in profit, and when it trades below it the average holder is at a loss. It is one of the core onchain metrics that many others have since be built off.
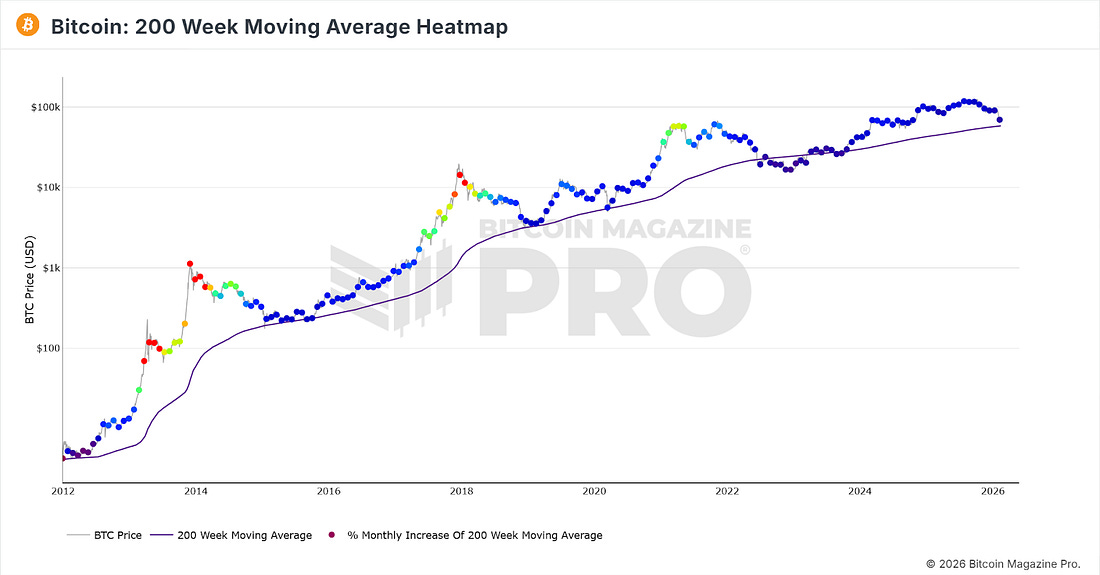
Figure 3: Realized Price It is currently at $54,887. It is worth noting that major bear market lows throughout Bitcoin history have arrived when BTC has started to trade below the Realized Price. Bitcoin 200-Week Moving Average The 200-week moving average is one of the most basic support levels for Bitcoin, being just a simple moving average. On Bitcoin’s move down to $60,000 on Feb 8, it came very close to tapping the moving average, which is currently at $58,200. Figure 4: 200 Week Moving Average
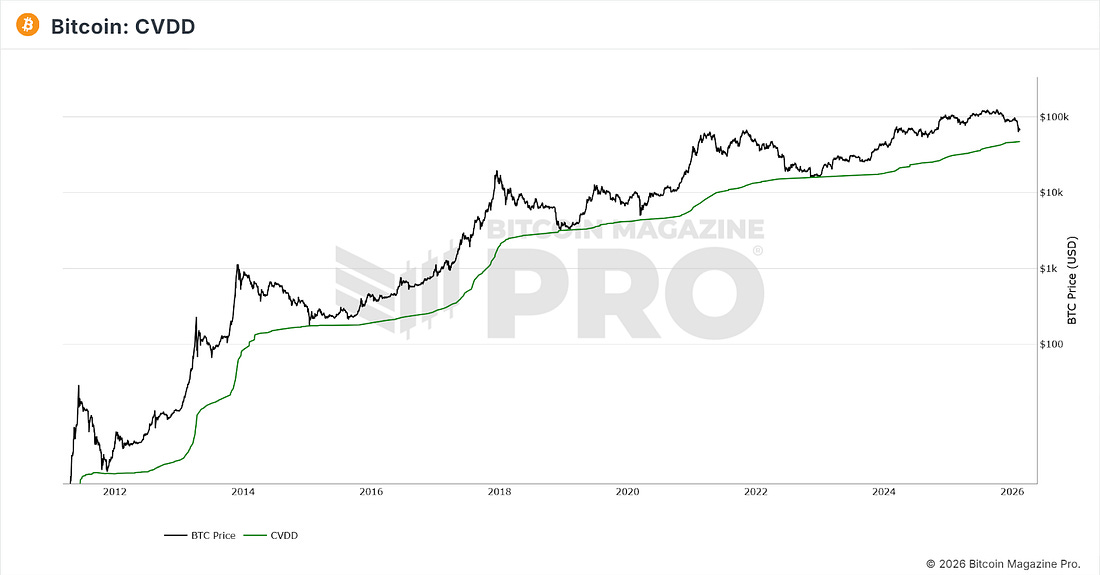
The chart above shows that throughout Bitcoin’s history, the 200WMA has generally held as support, except during the FTX crash in 2022, when BTC spent several weeks below it before breaking back above and entering a new bull run. Cumulative Value Days Destroyed (CVDD) A metric devised by Willy Woo, this indicator has successfully identified every major bear-market low in prior bear markets.
Figure 5: CVDD This metric is a derivative of the well-established Coin Days Destroyed, dividing the destruction accumulated over time by the market’s age. The result is the green line on the chart above, which BTC has reached in all previous bear markets. It is currently trading at $47,156. These are the three major supports remaining below the current price for BTC. However, we are in a new era for Bitcoin, with institutions now acting as the major players in the market. So is this time different when it comes to the bear market low? Only time will tell. To view all of these charts and receive more in-depth analysis, subscribe to the Bitcoin Magazine Pro platform here. The Bitcoin Magazine Pro Team. Bitcoin Magazine Pro
For more detailed Bitcoin analysis and to access advanced features like live charts, personalized indicator alerts, and in-depth industry reports, check out Bitcoin Magazine Pro. Make Smarter Decisions About Bitcoin. Join millions of investors who get clarity about Bitcoin using data analytics you can’t get anywhere else. We don’t just provide data for data’s sake, we provide the metrics and tools that really matter. So you get to supercharge your insights, not your workload. Take the next step in your Bitcoin investing journey:
Invest wisely, stay informed, and let data drive your decisions. Thank you for reading, and here’s to your future success in the Bitcoin market! Disclaimer: This newsletter is for informational purposes only and should not be considered financial advice. Always do your own research before making any investment decisions. We sincerely appreciate your support and hope you found this content valuable. Please leave a like and let us know your thoughts in the comments section; we always welcome feedback from our audience!
|
Monday, February 16, 2026
3 Potential Levels for a Bear Market Low


Subscribe to:
Post Comments (Atom)
Popular Posts
-
An AI/Fable 5 opinion post, alongside all the things you may have missed from TBL this week. ͏ ͏ ͏ ͏ ͏ ͏ ...
-
Join DAS Asia's Most Exclusive Networking Experience ...
-
A look at everything new on Pulse this month ͏ ͏ ͏ ͏ ͏ ͏ ͏ ͏ ͏ ͏ ͏ ͏ ͏ ...
-
Bitcoin jumped after a surprise Iran ceasefire headline—now watch the 200WMA hold and the 200DMA at $77.5K as the next reclaim level. ...
-
March 13, 2024 | Read Online 💥Ethereum Targets L2 Scalability As Dencun Goes Live Together with GM Defiers! Ethereum's highly-...


No comments:
Post a Comment